Portuguese vs Immigrants from Sudan Self-Care Disability
COMPARE
Portuguese
Immigrants from Sudan
Self-Care Disability
Self-Care Disability Comparison
Portuguese
Immigrants from Sudan
2.6%
SELF-CARE DISABILITY
0.4/ 100
METRIC RATING
250th/ 347
METRIC RANK
2.3%
SELF-CARE DISABILITY
99.8/ 100
METRIC RATING
41st/ 347
METRIC RANK
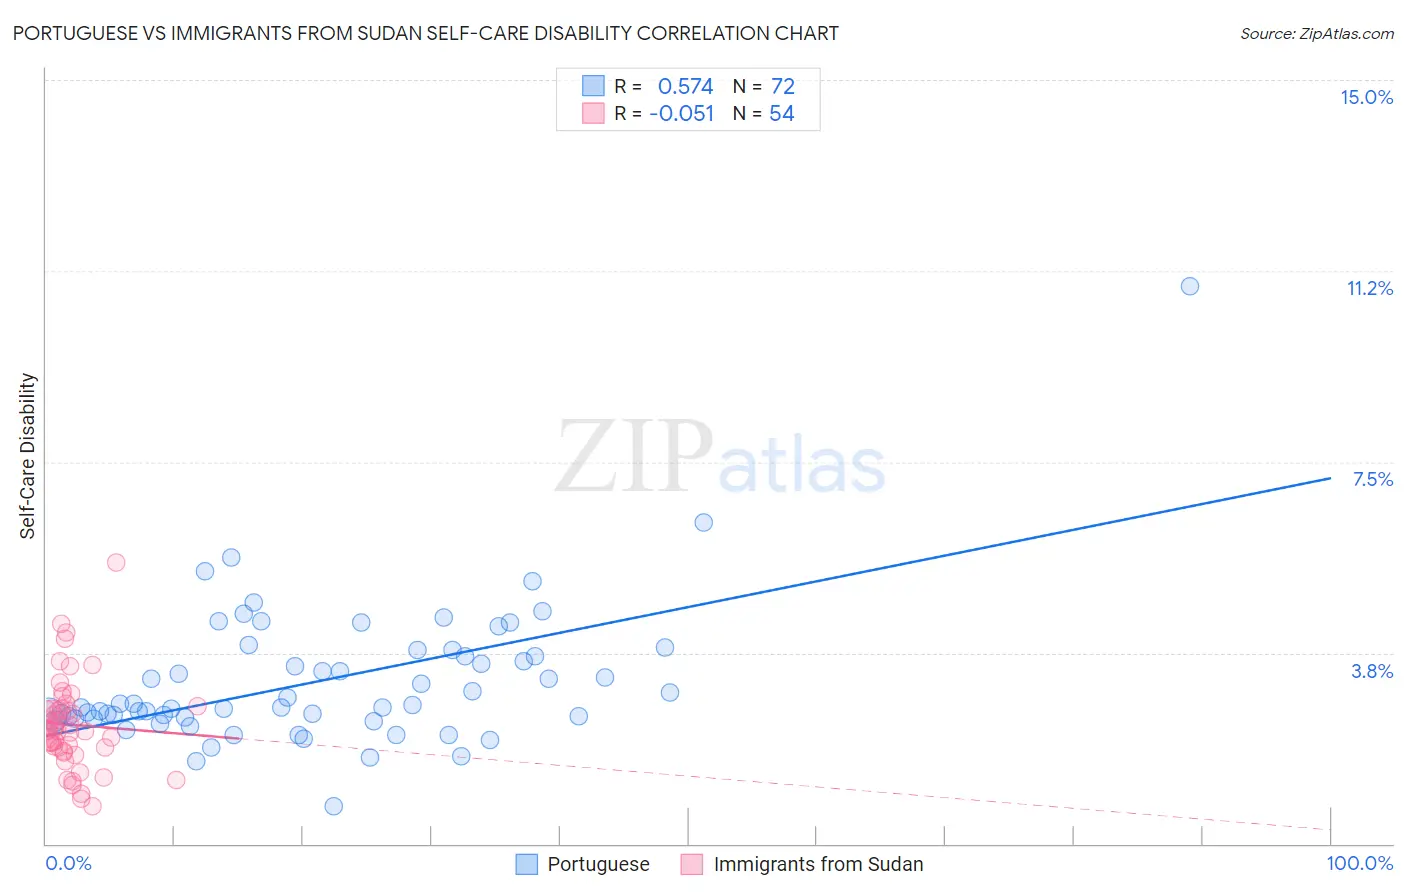
Portuguese vs Immigrants from Sudan Self-Care Disability Correlation Chart
The statistical analysis conducted on geographies consisting of 449,515,942 people shows a substantial positive correlation between the proportion of Portuguese and percentage of population with self-care disability in the United States with a correlation coefficient (R) of 0.574 and weighted average of 2.6%. Similarly, the statistical analysis conducted on geographies consisting of 118,937,078 people shows a slight negative correlation between the proportion of Immigrants from Sudan and percentage of population with self-care disability in the United States with a correlation coefficient (R) of -0.051 and weighted average of 2.3%, a difference of 15.2%.
Self-Care Disability Correlation Summary
| Measurement | Portuguese | Immigrants from Sudan |
| Minimum | 0.74% | 0.73% |
| Maximum | 11.0% | 5.5% |
| Range | 10.2% | 4.8% |
| Mean | 3.2% | 2.3% |
| Median | 2.7% | 2.2% |
| Interquartile 25% (IQ1) | 2.5% | 1.9% |
| Interquartile 75% (IQ3) | 3.7% | 2.6% |
| Interquartile Range (IQR) | 1.3% | 0.77% |
| Standard Deviation (Sample) | 1.4% | 0.91% |
| Standard Deviation (Population) | 1.4% | 0.90% |
Similar Demographics by Self-Care Disability
Demographics Similar to Portuguese by Self-Care Disability
In terms of self-care disability, the demographic groups most similar to Portuguese are Mexican American Indian (2.6%, a difference of 0.080%), Immigrants from Liberia (2.6%, a difference of 0.080%), Immigrants from Bangladesh (2.6%, a difference of 0.15%), Immigrants from Haiti (2.6%, a difference of 0.23%), and Haitian (2.6%, a difference of 0.25%).
| Demographics | Rating | Rank | Self-Care Disability |
| Hawaiians | 0.8 /100 | #243 | Tragic 2.6% |
| Yuman | 0.8 /100 | #244 | Tragic 2.6% |
| Immigrants | Western Asia | 0.6 /100 | #245 | Tragic 2.6% |
| Cheyenne | 0.6 /100 | #246 | Tragic 2.6% |
| Immigrants | Albania | 0.6 /100 | #247 | Tragic 2.6% |
| Nicaraguans | 0.6 /100 | #248 | Tragic 2.6% |
| Mexican American Indians | 0.5 /100 | #249 | Tragic 2.6% |
| Portuguese | 0.4 /100 | #250 | Tragic 2.6% |
| Immigrants | Liberia | 0.4 /100 | #251 | Tragic 2.6% |
| Immigrants | Bangladesh | 0.4 /100 | #252 | Tragic 2.6% |
| Immigrants | Haiti | 0.3 /100 | #253 | Tragic 2.6% |
| Haitians | 0.3 /100 | #254 | Tragic 2.6% |
| Tsimshian | 0.3 /100 | #255 | Tragic 2.6% |
| Immigrants | Central America | 0.3 /100 | #256 | Tragic 2.6% |
| Potawatomi | 0.3 /100 | #257 | Tragic 2.6% |
Demographics Similar to Immigrants from Sudan by Self-Care Disability
In terms of self-care disability, the demographic groups most similar to Immigrants from Sudan are Iranian (2.3%, a difference of 0.070%), Immigrants from Uganda (2.3%, a difference of 0.10%), Immigrants from Bulgaria (2.3%, a difference of 0.11%), Immigrants from Pakistan (2.3%, a difference of 0.14%), and Immigrants from South Africa (2.3%, a difference of 0.19%).
| Demographics | Rating | Rank | Self-Care Disability |
| Immigrants | Turkey | 99.9 /100 | #34 | Exceptional 2.3% |
| Immigrants | Australia | 99.9 /100 | #35 | Exceptional 2.3% |
| Immigrants | Lithuania | 99.9 /100 | #36 | Exceptional 2.3% |
| Immigrants | Sweden | 99.9 /100 | #37 | Exceptional 2.3% |
| Immigrants | Eastern Africa | 99.9 /100 | #38 | Exceptional 2.3% |
| Immigrants | Bulgaria | 99.8 /100 | #39 | Exceptional 2.3% |
| Iranians | 99.8 /100 | #40 | Exceptional 2.3% |
| Immigrants | Sudan | 99.8 /100 | #41 | Exceptional 2.3% |
| Immigrants | Uganda | 99.8 /100 | #42 | Exceptional 2.3% |
| Immigrants | Pakistan | 99.8 /100 | #43 | Exceptional 2.3% |
| Immigrants | South Africa | 99.8 /100 | #44 | Exceptional 2.3% |
| Norwegians | 99.8 /100 | #45 | Exceptional 2.3% |
| Czechs | 99.8 /100 | #46 | Exceptional 2.3% |
| Jordanians | 99.7 /100 | #47 | Exceptional 2.3% |
| Immigrants | Malaysia | 99.7 /100 | #48 | Exceptional 2.3% |