South African vs Comanche Self-Care Disability
COMPARE
South African
Comanche
Self-Care Disability
Self-Care Disability Comparison
South Africans
Comanche
2.3%
SELF-CARE DISABILITY
99.3/ 100
METRIC RATING
67th/ 347
METRIC RANK
2.9%
SELF-CARE DISABILITY
0.0/ 100
METRIC RATING
322nd/ 347
METRIC RANK
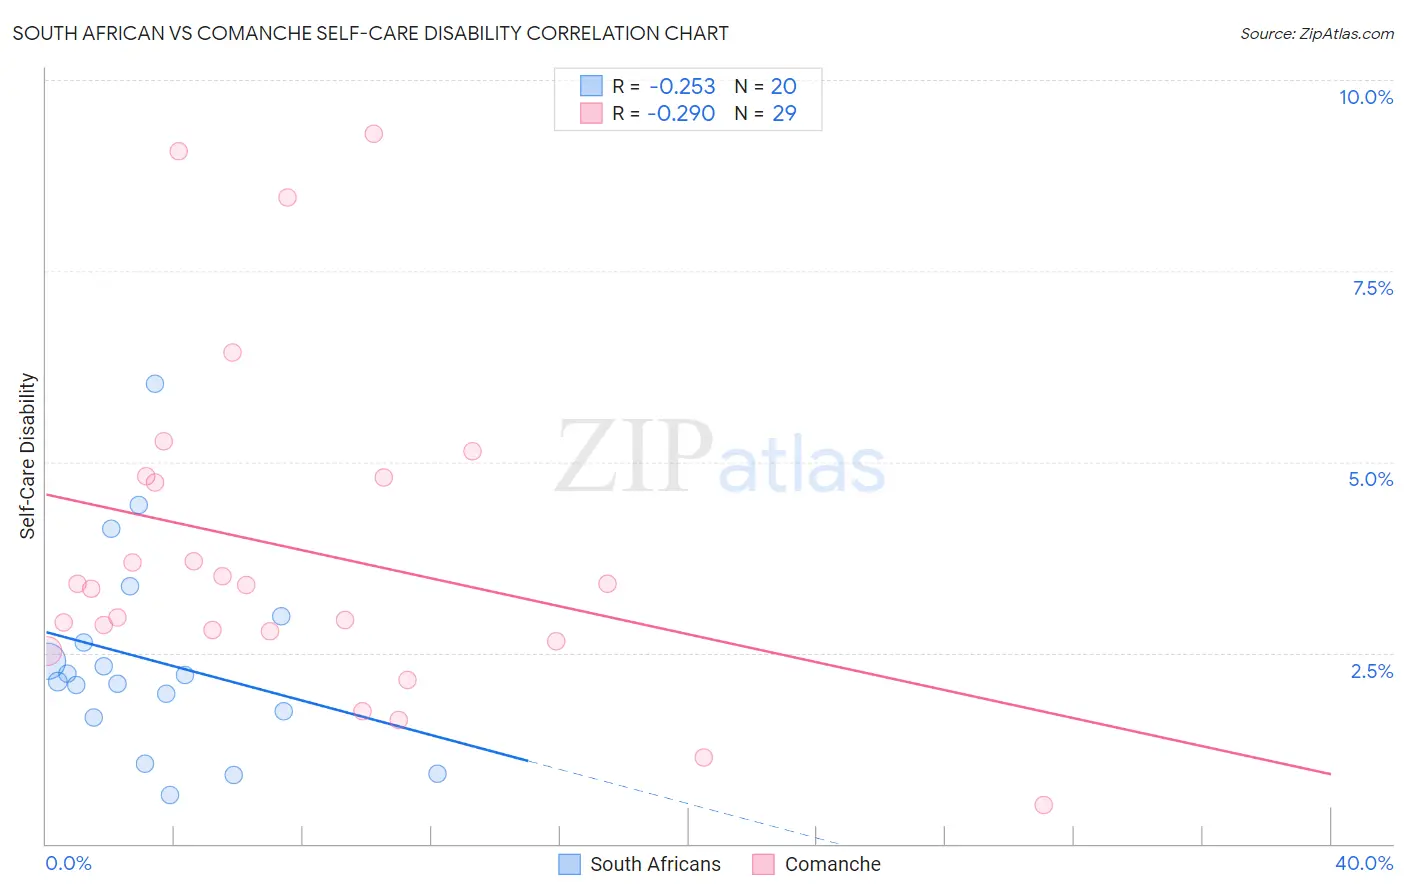
South African vs Comanche Self-Care Disability Correlation Chart
The statistical analysis conducted on geographies consisting of 182,494,090 people shows a weak negative correlation between the proportion of South Africans and percentage of population with self-care disability in the United States with a correlation coefficient (R) of -0.253 and weighted average of 2.3%. Similarly, the statistical analysis conducted on geographies consisting of 109,703,809 people shows a weak negative correlation between the proportion of Comanche and percentage of population with self-care disability in the United States with a correlation coefficient (R) of -0.290 and weighted average of 2.9%, a difference of 23.7%.
Self-Care Disability Correlation Summary
| Measurement | South African | Comanche |
| Minimum | 0.63% | 0.50% |
| Maximum | 6.0% | 9.3% |
| Range | 5.4% | 8.8% |
| Mean | 2.4% | 3.9% |
| Median | 2.2% | 3.4% |
| Interquartile 25% (IQ1) | 1.7% | 2.7% |
| Interquartile 75% (IQ3) | 2.8% | 4.8% |
| Interquartile Range (IQR) | 1.1% | 2.1% |
| Standard Deviation (Sample) | 1.3% | 2.2% |
| Standard Deviation (Population) | 1.3% | 2.1% |
Similar Demographics by Self-Care Disability
Demographics Similar to South Africans by Self-Care Disability
In terms of self-care disability, the demographic groups most similar to South Africans are Immigrants from Argentina (2.3%, a difference of 0.030%), Brazilian (2.3%, a difference of 0.060%), Immigrants from Zaire (2.3%, a difference of 0.090%), Immigrants from Norway (2.3%, a difference of 0.090%), and Swedish (2.3%, a difference of 0.12%).
| Demographics | Rating | Rank | Self-Care Disability |
| Immigrants | Japan | 99.5 /100 | #60 | Exceptional 2.3% |
| Palestinians | 99.4 /100 | #61 | Exceptional 2.3% |
| Egyptians | 99.4 /100 | #62 | Exceptional 2.3% |
| Mongolians | 99.3 /100 | #63 | Exceptional 2.3% |
| Swedes | 99.3 /100 | #64 | Exceptional 2.3% |
| Brazilians | 99.3 /100 | #65 | Exceptional 2.3% |
| Immigrants | Argentina | 99.3 /100 | #66 | Exceptional 2.3% |
| South Africans | 99.3 /100 | #67 | Exceptional 2.3% |
| Immigrants | Zaire | 99.2 /100 | #68 | Exceptional 2.3% |
| Immigrants | Norway | 99.2 /100 | #69 | Exceptional 2.3% |
| Immigrants | Northern Europe | 99.2 /100 | #70 | Exceptional 2.3% |
| Asians | 99.2 /100 | #71 | Exceptional 2.3% |
| Eastern Europeans | 99.2 /100 | #72 | Exceptional 2.3% |
| Immigrants | Egypt | 99.1 /100 | #73 | Exceptional 2.3% |
| Immigrants | Switzerland | 99.1 /100 | #74 | Exceptional 2.3% |
Demographics Similar to Comanche by Self-Care Disability
In terms of self-care disability, the demographic groups most similar to Comanche are Seminole (2.9%, a difference of 0.12%), Cherokee (2.9%, a difference of 0.22%), Navajo (2.9%, a difference of 0.32%), Chickasaw (2.9%, a difference of 0.47%), and Spanish American Indian (2.9%, a difference of 0.69%).
| Demographics | Rating | Rank | Self-Care Disability |
| Immigrants | Cuba | 0.0 /100 | #315 | Tragic 2.8% |
| Menominee | 0.0 /100 | #316 | Tragic 2.8% |
| Immigrants | Dominica | 0.0 /100 | #317 | Tragic 2.8% |
| Assyrians/Chaldeans/Syriacs | 0.0 /100 | #318 | Tragic 2.8% |
| Spanish American Indians | 0.0 /100 | #319 | Tragic 2.9% |
| Chickasaw | 0.0 /100 | #320 | Tragic 2.9% |
| Navajo | 0.0 /100 | #321 | Tragic 2.9% |
| Comanche | 0.0 /100 | #322 | Tragic 2.9% |
| Seminole | 0.0 /100 | #323 | Tragic 2.9% |
| Cherokee | 0.0 /100 | #324 | Tragic 2.9% |
| Immigrants | Uzbekistan | 0.0 /100 | #325 | Tragic 2.9% |
| Paiute | 0.0 /100 | #326 | Tragic 2.9% |
| Blacks/African Americans | 0.0 /100 | #327 | Tragic 2.9% |
| Hopi | 0.0 /100 | #328 | Tragic 2.9% |
| Cajuns | 0.0 /100 | #329 | Tragic 2.9% |