Panamanian vs Comanche Associate's Degree
COMPARE
Panamanian
Comanche
Associate's Degree
Associate's Degree Comparison
Panamanians
Comanche
45.1%
ASSOCIATE'S DEGREE
18.4/ 100
METRIC RATING
207th/ 347
METRIC RANK
39.9%
ASSOCIATE'S DEGREE
0.1/ 100
METRIC RATING
284th/ 347
METRIC RANK
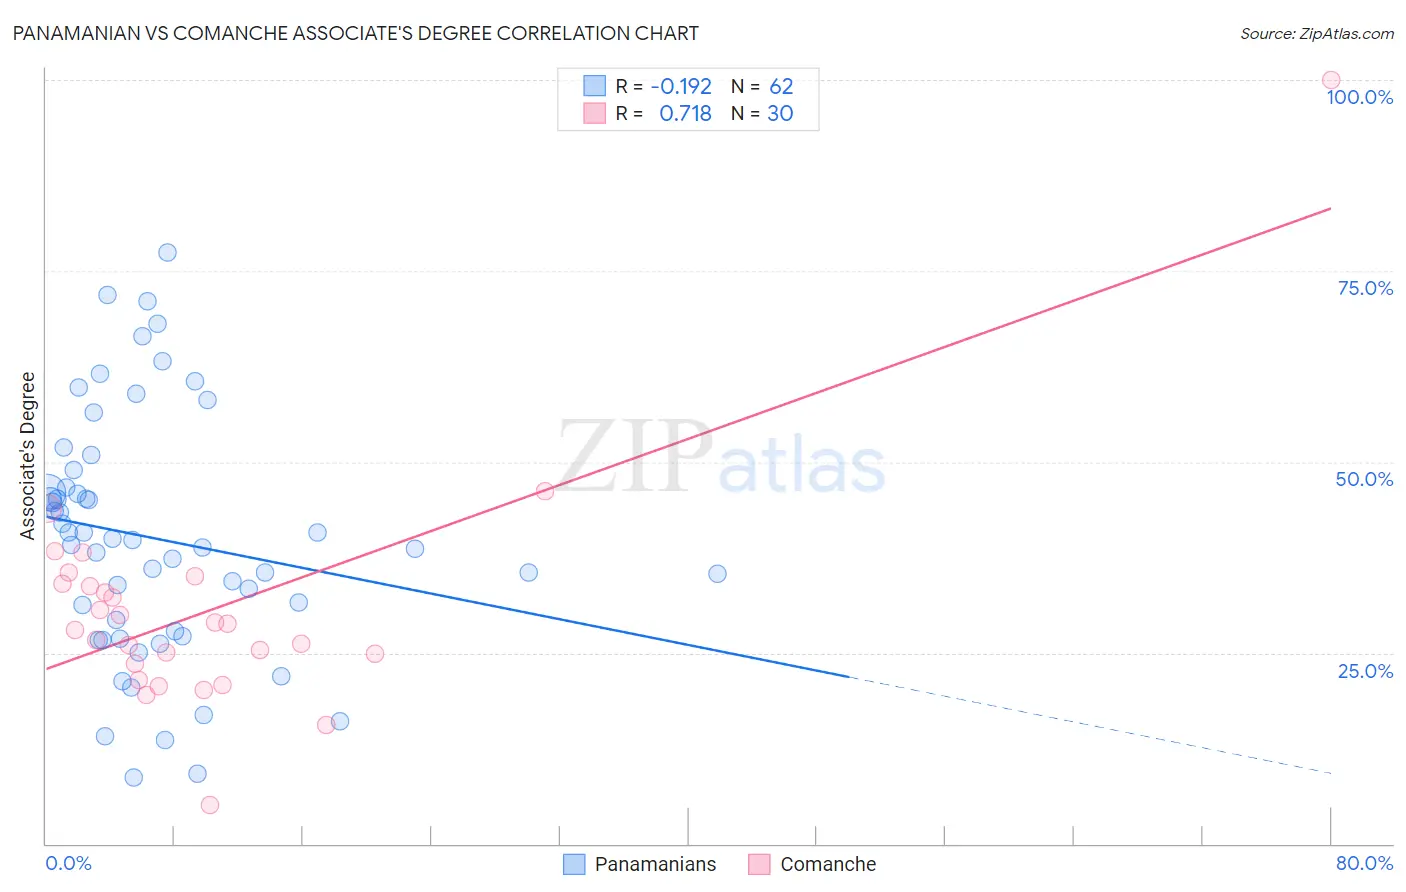
Panamanian vs Comanche Associate's Degree Correlation Chart
The statistical analysis conducted on geographies consisting of 281,234,684 people shows a poor negative correlation between the proportion of Panamanians and percentage of population with at least associate's degree education in the United States with a correlation coefficient (R) of -0.192 and weighted average of 45.1%. Similarly, the statistical analysis conducted on geographies consisting of 109,785,632 people shows a strong positive correlation between the proportion of Comanche and percentage of population with at least associate's degree education in the United States with a correlation coefficient (R) of 0.718 and weighted average of 39.9%, a difference of 12.9%.
Associate's Degree Correlation Summary
| Measurement | Panamanian | Comanche |
| Minimum | 8.6% | 5.1% |
| Maximum | 77.4% | 100.0% |
| Range | 68.8% | 94.9% |
| Mean | 39.9% | 30.6% |
| Median | 39.4% | 28.4% |
| Interquartile 25% (IQ1) | 27.9% | 23.5% |
| Interquartile 75% (IQ3) | 46.6% | 34.0% |
| Interquartile Range (IQR) | 18.7% | 10.5% |
| Standard Deviation (Sample) | 15.9% | 15.6% |
| Standard Deviation (Population) | 15.8% | 15.3% |
Similar Demographics by Associate's Degree
Demographics Similar to Panamanians by Associate's Degree
In terms of associate's degree, the demographic groups most similar to Panamanians are Immigrants from Thailand (45.1%, a difference of 0.070%), German Russian (45.1%, a difference of 0.070%), Nigerian (45.1%, a difference of 0.090%), Dutch (45.0%, a difference of 0.10%), and Immigrants from Costa Rica (45.0%, a difference of 0.22%).
| Demographics | Rating | Rank | Associate's Degree |
| Senegalese | 21.1 /100 | #200 | Fair 45.2% |
| Immigrants | Vietnam | 20.8 /100 | #201 | Fair 45.2% |
| Spaniards | 20.4 /100 | #202 | Fair 45.2% |
| Immigrants | South Eastern Asia | 20.2 /100 | #203 | Fair 45.2% |
| Nigerians | 19.1 /100 | #204 | Poor 45.1% |
| Immigrants | Thailand | 18.9 /100 | #205 | Poor 45.1% |
| German Russians | 18.9 /100 | #206 | Poor 45.1% |
| Panamanians | 18.4 /100 | #207 | Poor 45.1% |
| Dutch | 17.6 /100 | #208 | Poor 45.0% |
| Immigrants | Costa Rica | 16.7 /100 | #209 | Poor 45.0% |
| Immigrants | Philippines | 16.7 /100 | #210 | Poor 45.0% |
| Immigrants | Zaire | 16.6 /100 | #211 | Poor 45.0% |
| French Canadians | 15.0 /100 | #212 | Poor 44.9% |
| Immigrants | Ghana | 14.2 /100 | #213 | Poor 44.8% |
| Immigrants | Middle Africa | 12.7 /100 | #214 | Poor 44.7% |
Demographics Similar to Comanche by Associate's Degree
In terms of associate's degree, the demographic groups most similar to Comanche are Immigrants from Belize (39.9%, a difference of 0.10%), Haitian (40.0%, a difference of 0.12%), Bangladeshi (40.0%, a difference of 0.26%), Immigrants from Caribbean (39.7%, a difference of 0.44%), and Immigrants from Portugal (40.1%, a difference of 0.58%).
| Demographics | Rating | Rank | Associate's Degree |
| Blackfeet | 0.1 /100 | #277 | Tragic 40.3% |
| Ottawa | 0.1 /100 | #278 | Tragic 40.3% |
| Immigrants | Nicaragua | 0.1 /100 | #279 | Tragic 40.3% |
| Immigrants | Micronesia | 0.1 /100 | #280 | Tragic 40.2% |
| Immigrants | Portugal | 0.1 /100 | #281 | Tragic 40.1% |
| Bangladeshis | 0.1 /100 | #282 | Tragic 40.0% |
| Haitians | 0.1 /100 | #283 | Tragic 40.0% |
| Comanche | 0.1 /100 | #284 | Tragic 39.9% |
| Immigrants | Belize | 0.1 /100 | #285 | Tragic 39.9% |
| Immigrants | Caribbean | 0.0 /100 | #286 | Tragic 39.7% |
| Aleuts | 0.0 /100 | #287 | Tragic 39.6% |
| Immigrants | Cuba | 0.0 /100 | #288 | Tragic 39.5% |
| Central Americans | 0.0 /100 | #289 | Tragic 39.4% |
| Immigrants | Haiti | 0.0 /100 | #290 | Tragic 39.3% |
| Dominicans | 0.0 /100 | #291 | Tragic 39.3% |