Panamanian vs Comanche Seniors Poverty Over the Age of 75
COMPARE
Panamanian
Comanche
Seniors Poverty Over the Age of 75
Seniors Poverty Over the Age of 75 Comparison
Panamanians
Comanche
13.4%
SENIORS POVERTY OVER THE AGE OF 75
0.8/ 100
METRIC RATING
239th/ 347
METRIC RANK
12.8%
SENIORS POVERTY OVER THE AGE OF 75
7.0/ 100
METRIC RATING
210th/ 347
METRIC RANK
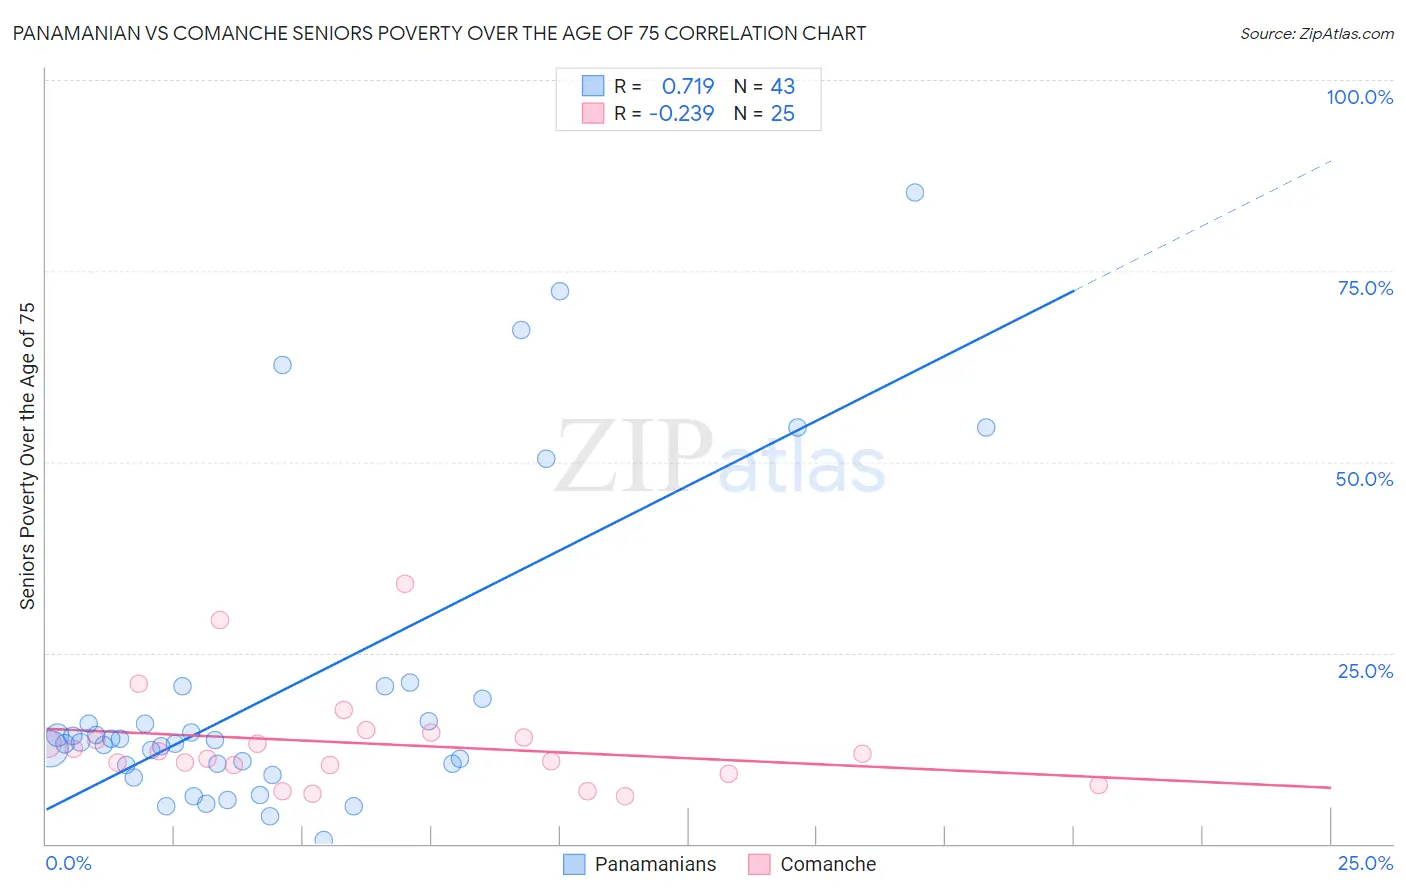
Panamanian vs Comanche Seniors Poverty Over the Age of 75 Correlation Chart
The statistical analysis conducted on geographies consisting of 279,070,600 people shows a strong positive correlation between the proportion of Panamanians and poverty level among seniors over the age of 75 in the United States with a correlation coefficient (R) of 0.719 and weighted average of 13.4%. Similarly, the statistical analysis conducted on geographies consisting of 109,150,338 people shows a weak negative correlation between the proportion of Comanche and poverty level among seniors over the age of 75 in the United States with a correlation coefficient (R) of -0.239 and weighted average of 12.8%, a difference of 4.3%.
Seniors Poverty Over the Age of 75 Correlation Summary
| Measurement | Panamanian | Comanche |
| Minimum | 0.43% | 6.1% |
| Maximum | 85.2% | 34.0% |
| Range | 84.8% | 27.9% |
| Mean | 20.3% | 13.1% |
| Median | 13.3% | 11.8% |
| Interquartile 25% (IQ1) | 10.3% | 9.7% |
| Interquartile 75% (IQ3) | 19.0% | 14.2% |
| Interquartile Range (IQR) | 8.7% | 4.5% |
| Standard Deviation (Sample) | 20.5% | 6.6% |
| Standard Deviation (Population) | 20.3% | 6.4% |
Similar Demographics by Seniors Poverty Over the Age of 75
Demographics Similar to Panamanians by Seniors Poverty Over the Age of 75
In terms of seniors poverty over the age of 75, the demographic groups most similar to Panamanians are Peruvian (13.4%, a difference of 0.10%), Alaskan Athabascan (13.4%, a difference of 0.12%), Moroccan (13.3%, a difference of 0.29%), Japanese (13.3%, a difference of 0.31%), and Argentinean (13.4%, a difference of 0.31%).
| Demographics | Rating | Rank | Seniors Poverty Over the Age of 75 |
| Immigrants | Chile | 1.3 /100 | #232 | Tragic 13.3% |
| Immigrants | Costa Rica | 1.3 /100 | #233 | Tragic 13.3% |
| Immigrants | Israel | 1.1 /100 | #234 | Tragic 13.3% |
| Japanese | 0.9 /100 | #235 | Tragic 13.3% |
| Moroccans | 0.9 /100 | #236 | Tragic 13.3% |
| Alaskan Athabascans | 0.8 /100 | #237 | Tragic 13.4% |
| Peruvians | 0.8 /100 | #238 | Tragic 13.4% |
| Panamanians | 0.8 /100 | #239 | Tragic 13.4% |
| Argentineans | 0.7 /100 | #240 | Tragic 13.4% |
| Immigrants | Russia | 0.6 /100 | #241 | Tragic 13.4% |
| Immigrants | Somalia | 0.6 /100 | #242 | Tragic 13.5% |
| Dutch West Indians | 0.6 /100 | #243 | Tragic 13.5% |
| Spanish Americans | 0.5 /100 | #244 | Tragic 13.5% |
| Uruguayans | 0.5 /100 | #245 | Tragic 13.5% |
| Immigrants | Cambodia | 0.4 /100 | #246 | Tragic 13.6% |
Demographics Similar to Comanche by Seniors Poverty Over the Age of 75
In terms of seniors poverty over the age of 75, the demographic groups most similar to Comanche are Brazilian (12.8%, a difference of 0.020%), Immigrants from Liberia (12.8%, a difference of 0.10%), Immigrants from Hong Kong (12.8%, a difference of 0.15%), French American Indian (12.9%, a difference of 0.30%), and Immigrants from Africa (12.9%, a difference of 0.37%).
| Demographics | Rating | Rank | Seniors Poverty Over the Age of 75 |
| Immigrants | Southern Europe | 10.7 /100 | #203 | Poor 12.7% |
| Immigrants | Eritrea | 10.5 /100 | #204 | Poor 12.7% |
| Indians (Asian) | 9.7 /100 | #205 | Tragic 12.7% |
| Albanians | 9.6 /100 | #206 | Tragic 12.7% |
| Costa Ricans | 8.7 /100 | #207 | Tragic 12.8% |
| Immigrants | Eastern Asia | 8.4 /100 | #208 | Tragic 12.8% |
| Immigrants | Liberia | 7.3 /100 | #209 | Tragic 12.8% |
| Comanche | 7.0 /100 | #210 | Tragic 12.8% |
| Brazilians | 6.9 /100 | #211 | Tragic 12.8% |
| Immigrants | Hong Kong | 6.5 /100 | #212 | Tragic 12.8% |
| French American Indians | 6.1 /100 | #213 | Tragic 12.9% |
| Immigrants | Africa | 5.9 /100 | #214 | Tragic 12.9% |
| South American Indians | 5.5 /100 | #215 | Tragic 12.9% |
| Immigrants | Brazil | 5.2 /100 | #216 | Tragic 12.9% |
| Bermudans | 4.9 /100 | #217 | Tragic 12.9% |