Immigrants from Burma/Myanmar vs Immigrants from Micronesia Disability
COMPARE
Immigrants from Burma/Myanmar
Immigrants from Micronesia
Disability
Disability Comparison
Immigrants from Burma/Myanmar
Immigrants from Micronesia
11.8%
DISABILITY
28.5/ 100
METRIC RATING
185th/ 347
METRIC RANK
13.2%
DISABILITY
0.0/ 100
METRIC RATING
301st/ 347
METRIC RANK
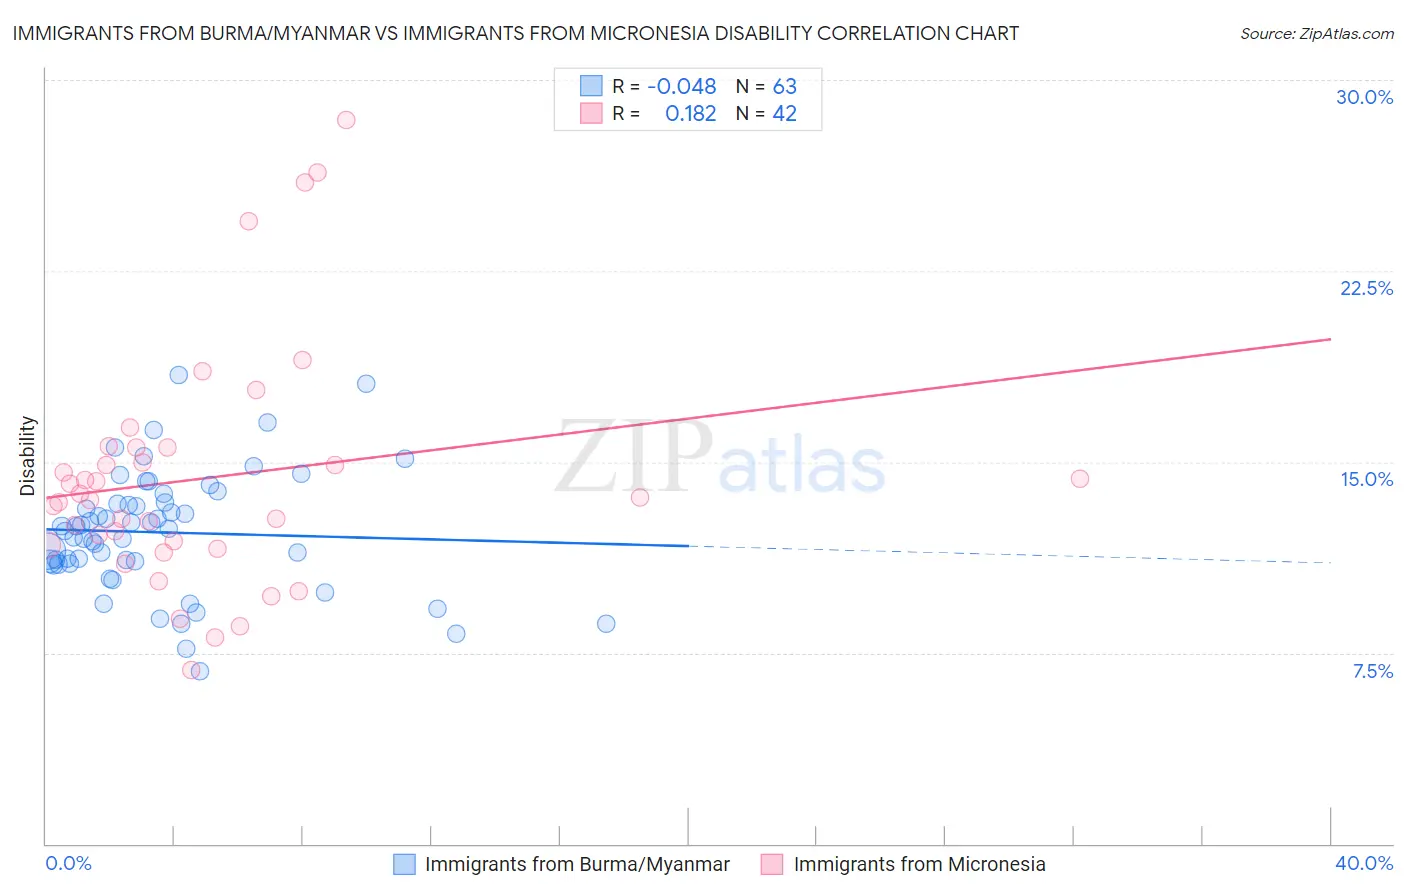
Immigrants from Burma/Myanmar vs Immigrants from Micronesia Disability Correlation Chart
The statistical analysis conducted on geographies consisting of 172,347,454 people shows no correlation between the proportion of Immigrants from Burma/Myanmar and percentage of population with a disability in the United States with a correlation coefficient (R) of -0.048 and weighted average of 11.8%. Similarly, the statistical analysis conducted on geographies consisting of 61,603,452 people shows a poor positive correlation between the proportion of Immigrants from Micronesia and percentage of population with a disability in the United States with a correlation coefficient (R) of 0.182 and weighted average of 13.2%, a difference of 11.6%.
Disability Correlation Summary
| Measurement | Immigrants from Burma/Myanmar | Immigrants from Micronesia |
| Minimum | 6.8% | 6.8% |
| Maximum | 18.4% | 28.4% |
| Range | 11.6% | 21.6% |
| Mean | 12.2% | 14.3% |
| Median | 12.4% | 13.6% |
| Interquartile 25% (IQ1) | 11.0% | 11.8% |
| Interquartile 75% (IQ3) | 13.4% | 15.6% |
| Interquartile Range (IQR) | 2.4% | 3.8% |
| Standard Deviation (Sample) | 2.3% | 4.7% |
| Standard Deviation (Population) | 2.3% | 4.7% |
Similar Demographics by Disability
Demographics Similar to Immigrants from Burma/Myanmar by Disability
In terms of disability, the demographic groups most similar to Immigrants from Burma/Myanmar are Immigrants from Scotland (11.8%, a difference of 0.010%), Lebanese (11.8%, a difference of 0.030%), Iraqi (11.8%, a difference of 0.080%), Honduran (11.8%, a difference of 0.14%), and Immigrants from Mexico (11.9%, a difference of 0.27%).
| Demographics | Rating | Rank | Disability |
| Greeks | 46.2 /100 | #178 | Average 11.7% |
| Immigrants | Armenia | 41.9 /100 | #179 | Average 11.7% |
| Immigrants | Honduras | 37.8 /100 | #180 | Fair 11.8% |
| Immigrants | Oceania | 34.3 /100 | #181 | Fair 11.8% |
| Icelanders | 34.0 /100 | #182 | Fair 11.8% |
| Hondurans | 31.2 /100 | #183 | Fair 11.8% |
| Iraqis | 30.0 /100 | #184 | Fair 11.8% |
| Immigrants | Burma/Myanmar | 28.5 /100 | #185 | Fair 11.8% |
| Immigrants | Scotland | 28.2 /100 | #186 | Fair 11.8% |
| Lebanese | 27.9 /100 | #187 | Fair 11.8% |
| Immigrants | Mexico | 23.8 /100 | #188 | Fair 11.9% |
| Immigrants | Zaire | 21.8 /100 | #189 | Fair 11.9% |
| Immigrants | West Indies | 21.1 /100 | #190 | Fair 11.9% |
| Ute | 19.5 /100 | #191 | Poor 11.9% |
| Lithuanians | 18.8 /100 | #192 | Poor 11.9% |
Demographics Similar to Immigrants from Micronesia by Disability
In terms of disability, the demographic groups most similar to Immigrants from Micronesia are Pennsylvania German (13.2%, a difference of 0.090%), French (13.2%, a difference of 0.13%), Alaska Native (13.2%, a difference of 0.15%), Hopi (13.2%, a difference of 0.16%), and Arapaho (13.2%, a difference of 0.21%).
| Demographics | Rating | Rank | Disability |
| Celtics | 0.0 /100 | #294 | Tragic 13.1% |
| Immigrants | Nonimmigrants | 0.0 /100 | #295 | Tragic 13.2% |
| Central American Indians | 0.0 /100 | #296 | Tragic 13.2% |
| Hopi | 0.0 /100 | #297 | Tragic 13.2% |
| Alaska Natives | 0.0 /100 | #298 | Tragic 13.2% |
| French | 0.0 /100 | #299 | Tragic 13.2% |
| Pennsylvania Germans | 0.0 /100 | #300 | Tragic 13.2% |
| Immigrants | Micronesia | 0.0 /100 | #301 | Tragic 13.2% |
| Arapaho | 0.0 /100 | #302 | Tragic 13.2% |
| Scotch-Irish | 0.0 /100 | #303 | Tragic 13.3% |
| Yakama | 0.0 /100 | #304 | Tragic 13.4% |
| French Canadians | 0.0 /100 | #305 | Tragic 13.4% |
| Cape Verdeans | 0.0 /100 | #306 | Tragic 13.5% |
| Shoshone | 0.0 /100 | #307 | Tragic 13.5% |
| French American Indians | 0.0 /100 | #308 | Tragic 13.5% |