Immigrants from Bulgaria vs Norwegian Male Disability
COMPARE
Immigrants from Bulgaria
Norwegian
Male Disability
Male Disability Comparison
Immigrants from Bulgaria
Norwegians
10.5%
MALE DISABILITY
99.1/ 100
METRIC RATING
70th/ 347
METRIC RANK
12.2%
MALE DISABILITY
0.2/ 100
METRIC RATING
262nd/ 347
METRIC RANK
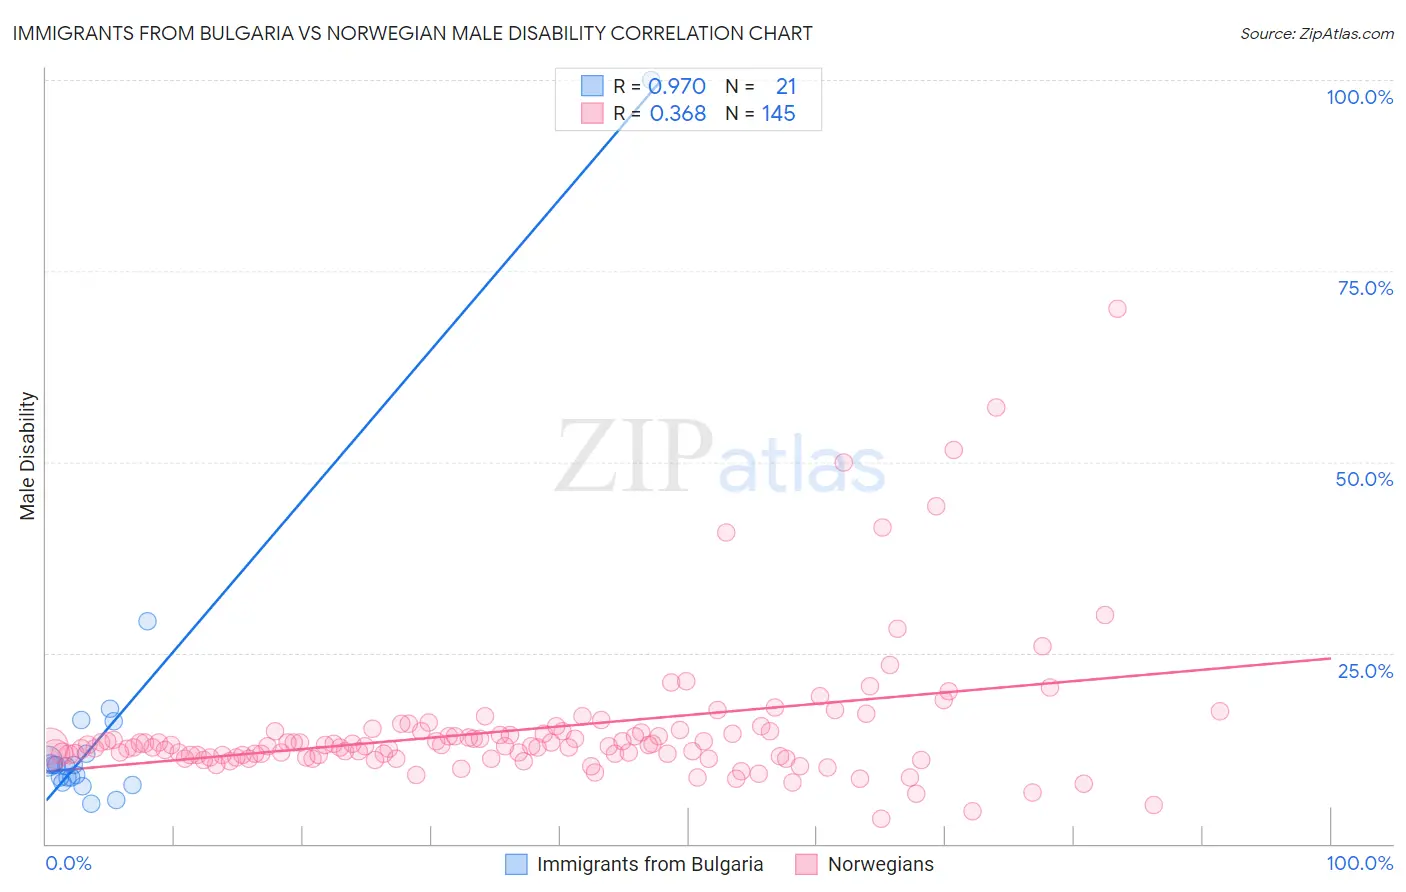
Immigrants from Bulgaria vs Norwegian Male Disability Correlation Chart
The statistical analysis conducted on geographies consisting of 172,550,350 people shows a perfect positive correlation between the proportion of Immigrants from Bulgaria and percentage of males with a disability in the United States with a correlation coefficient (R) of 0.970 and weighted average of 10.5%. Similarly, the statistical analysis conducted on geographies consisting of 533,169,382 people shows a mild positive correlation between the proportion of Norwegians and percentage of males with a disability in the United States with a correlation coefficient (R) of 0.368 and weighted average of 12.2%, a difference of 16.1%.
Male Disability Correlation Summary
| Measurement | Immigrants from Bulgaria | Norwegian |
| Minimum | 5.2% | 3.3% |
| Maximum | 100.0% | 70.0% |
| Range | 94.8% | 66.7% |
| Mean | 15.4% | 15.0% |
| Median | 10.3% | 12.8% |
| Interquartile 25% (IQ1) | 8.3% | 11.5% |
| Interquartile 75% (IQ3) | 14.0% | 14.7% |
| Interquartile Range (IQR) | 5.7% | 3.2% |
| Standard Deviation (Sample) | 20.1% | 9.1% |
| Standard Deviation (Population) | 19.6% | 9.1% |
Similar Demographics by Male Disability
Demographics Similar to Immigrants from Bulgaria by Male Disability
In terms of male disability, the demographic groups most similar to Immigrants from Bulgaria are Colombian (10.5%, a difference of 0.14%), Ecuadorian (10.5%, a difference of 0.14%), Immigrants from Cameroon (10.5%, a difference of 0.15%), Immigrants from Serbia (10.5%, a difference of 0.20%), and Immigrants from Afghanistan (10.5%, a difference of 0.24%).
| Demographics | Rating | Rank | Male Disability |
| Immigrants | Belarus | 99.3 /100 | #63 | Exceptional 10.4% |
| Jordanians | 99.3 /100 | #64 | Exceptional 10.5% |
| Immigrants | Grenada | 99.2 /100 | #65 | Exceptional 10.5% |
| Guyanese | 99.2 /100 | #66 | Exceptional 10.5% |
| Immigrants | Afghanistan | 99.2 /100 | #67 | Exceptional 10.5% |
| Colombians | 99.2 /100 | #68 | Exceptional 10.5% |
| Ecuadorians | 99.2 /100 | #69 | Exceptional 10.5% |
| Immigrants | Bulgaria | 99.1 /100 | #70 | Exceptional 10.5% |
| Immigrants | Cameroon | 99.0 /100 | #71 | Exceptional 10.5% |
| Immigrants | Serbia | 99.0 /100 | #72 | Exceptional 10.5% |
| Immigrants | Lithuania | 98.9 /100 | #73 | Exceptional 10.5% |
| Immigrants | Lebanon | 98.8 /100 | #74 | Exceptional 10.5% |
| Sierra Leoneans | 98.7 /100 | #75 | Exceptional 10.5% |
| Immigrants | Sierra Leone | 98.7 /100 | #76 | Exceptional 10.5% |
| Laotians | 98.6 /100 | #77 | Exceptional 10.6% |
Demographics Similar to Norwegians by Male Disability
In terms of male disability, the demographic groups most similar to Norwegians are Slavic (12.2%, a difference of 0.010%), Canadian (12.2%, a difference of 0.20%), Nepalese (12.2%, a difference of 0.23%), Swedish (12.1%, a difference of 0.37%), and Belgian (12.1%, a difference of 0.44%).
| Demographics | Rating | Rank | Male Disability |
| Chinese | 0.4 /100 | #255 | Tragic 12.1% |
| Swiss | 0.3 /100 | #256 | Tragic 12.1% |
| Europeans | 0.3 /100 | #257 | Tragic 12.1% |
| Basques | 0.3 /100 | #258 | Tragic 12.1% |
| Belgians | 0.3 /100 | #259 | Tragic 12.1% |
| Swedes | 0.3 /100 | #260 | Tragic 12.1% |
| Slavs | 0.2 /100 | #261 | Tragic 12.2% |
| Norwegians | 0.2 /100 | #262 | Tragic 12.2% |
| Canadians | 0.2 /100 | #263 | Tragic 12.2% |
| Nepalese | 0.2 /100 | #264 | Tragic 12.2% |
| Immigrants | Portugal | 0.1 /100 | #265 | Tragic 12.3% |
| Hawaiians | 0.1 /100 | #266 | Tragic 12.3% |
| Immigrants | Germany | 0.1 /100 | #267 | Tragic 12.3% |
| Portuguese | 0.1 /100 | #268 | Tragic 12.3% |
| Czechoslovakians | 0.1 /100 | #269 | Tragic 12.3% |