Honduran vs Norwegian Male Disability
COMPARE
Honduran
Norwegian
Male Disability
Male Disability Comparison
Hondurans
Norwegians
11.3%
MALE DISABILITY
41.1/ 100
METRIC RATING
180th/ 347
METRIC RANK
12.2%
MALE DISABILITY
0.2/ 100
METRIC RATING
262nd/ 347
METRIC RANK
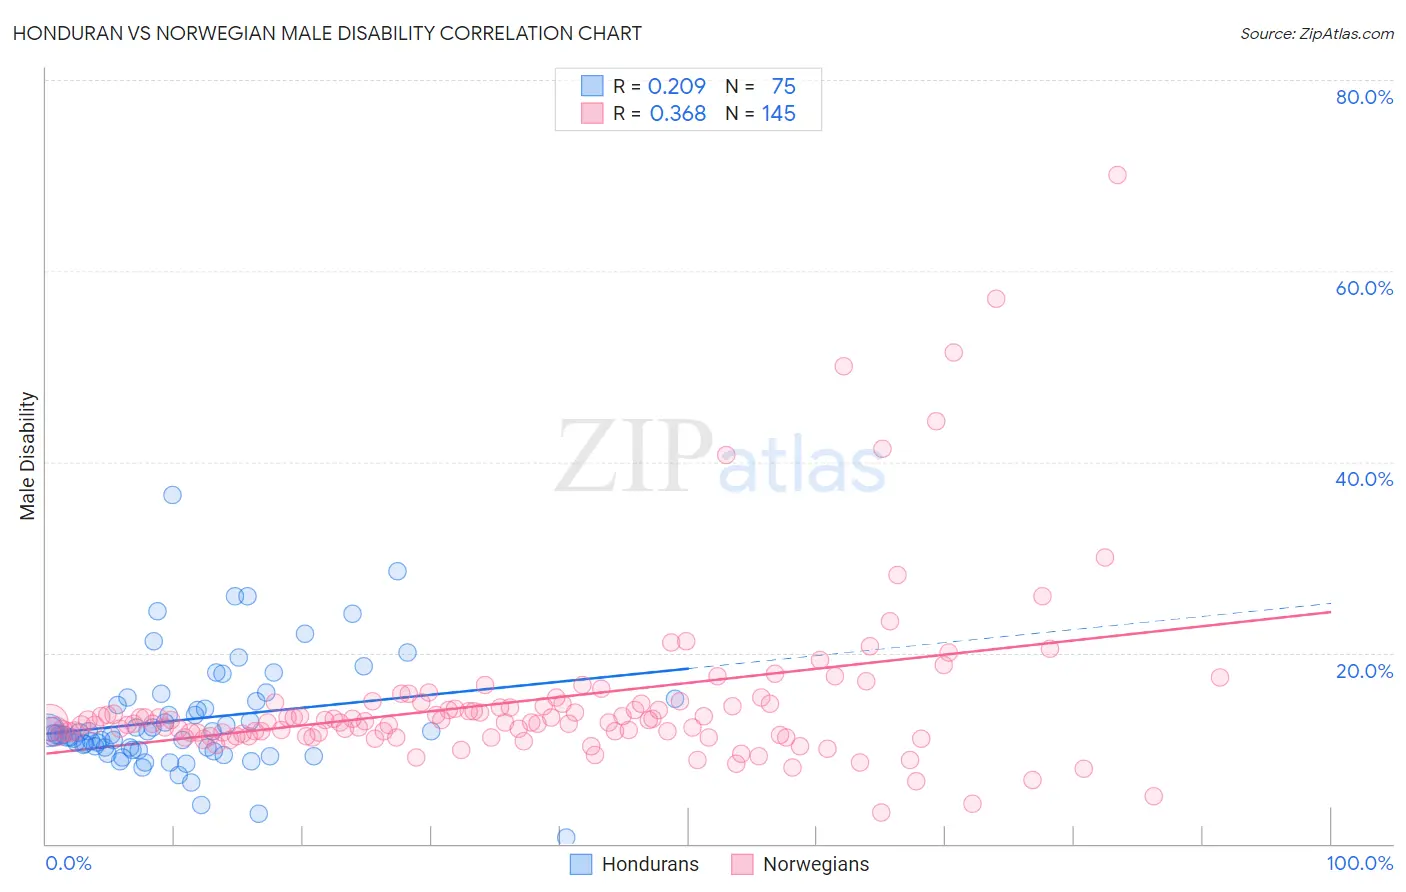
Honduran vs Norwegian Male Disability Correlation Chart
The statistical analysis conducted on geographies consisting of 357,765,878 people shows a weak positive correlation between the proportion of Hondurans and percentage of males with a disability in the United States with a correlation coefficient (R) of 0.209 and weighted average of 11.3%. Similarly, the statistical analysis conducted on geographies consisting of 533,169,382 people shows a mild positive correlation between the proportion of Norwegians and percentage of males with a disability in the United States with a correlation coefficient (R) of 0.368 and weighted average of 12.2%, a difference of 8.0%.
Male Disability Correlation Summary
| Measurement | Honduran | Norwegian |
| Minimum | 0.65% | 3.3% |
| Maximum | 36.5% | 70.0% |
| Range | 35.9% | 66.7% |
| Mean | 13.0% | 15.0% |
| Median | 11.4% | 12.8% |
| Interquartile 25% (IQ1) | 9.8% | 11.5% |
| Interquartile 75% (IQ3) | 15.0% | 14.7% |
| Interquartile Range (IQR) | 5.1% | 3.2% |
| Standard Deviation (Sample) | 5.8% | 9.1% |
| Standard Deviation (Population) | 5.8% | 9.1% |
Similar Demographics by Male Disability
Demographics Similar to Hondurans by Male Disability
In terms of male disability, the demographic groups most similar to Hondurans are Immigrants from Caribbean (11.3%, a difference of 0.020%), Australian (11.3%, a difference of 0.060%), Immigrants from Norway (11.3%, a difference of 0.17%), Syrian (11.2%, a difference of 0.31%), and Immigrants from Senegal (11.3%, a difference of 0.40%).
| Demographics | Rating | Rank | Male Disability |
| Immigrants | Burma/Myanmar | 50.4 /100 | #173 | Average 11.2% |
| Maltese | 50.0 /100 | #174 | Average 11.2% |
| Immigrants | Honduras | 48.7 /100 | #175 | Average 11.2% |
| Syrians | 46.6 /100 | #176 | Average 11.2% |
| Immigrants | Norway | 44.2 /100 | #177 | Average 11.3% |
| Australians | 42.2 /100 | #178 | Average 11.3% |
| Immigrants | Caribbean | 41.4 /100 | #179 | Average 11.3% |
| Hondurans | 41.1 /100 | #180 | Average 11.3% |
| Immigrants | Senegal | 34.4 /100 | #181 | Fair 11.3% |
| Immigrants | Belize | 33.7 /100 | #182 | Fair 11.3% |
| Immigrants | Central America | 32.9 /100 | #183 | Fair 11.3% |
| Iraqis | 30.5 /100 | #184 | Fair 11.3% |
| Pakistanis | 30.3 /100 | #185 | Fair 11.3% |
| Immigrants | Zaire | 27.6 /100 | #186 | Fair 11.4% |
| Immigrants | Austria | 27.3 /100 | #187 | Fair 11.4% |
Demographics Similar to Norwegians by Male Disability
In terms of male disability, the demographic groups most similar to Norwegians are Slavic (12.2%, a difference of 0.010%), Canadian (12.2%, a difference of 0.20%), Nepalese (12.2%, a difference of 0.23%), Swedish (12.1%, a difference of 0.37%), and Belgian (12.1%, a difference of 0.44%).
| Demographics | Rating | Rank | Male Disability |
| Chinese | 0.4 /100 | #255 | Tragic 12.1% |
| Swiss | 0.3 /100 | #256 | Tragic 12.1% |
| Europeans | 0.3 /100 | #257 | Tragic 12.1% |
| Basques | 0.3 /100 | #258 | Tragic 12.1% |
| Belgians | 0.3 /100 | #259 | Tragic 12.1% |
| Swedes | 0.3 /100 | #260 | Tragic 12.1% |
| Slavs | 0.2 /100 | #261 | Tragic 12.2% |
| Norwegians | 0.2 /100 | #262 | Tragic 12.2% |
| Canadians | 0.2 /100 | #263 | Tragic 12.2% |
| Nepalese | 0.2 /100 | #264 | Tragic 12.2% |
| Immigrants | Portugal | 0.1 /100 | #265 | Tragic 12.3% |
| Hawaiians | 0.1 /100 | #266 | Tragic 12.3% |
| Immigrants | Germany | 0.1 /100 | #267 | Tragic 12.3% |
| Portuguese | 0.1 /100 | #268 | Tragic 12.3% |
| Czechoslovakians | 0.1 /100 | #269 | Tragic 12.3% |