Immigrants from Congo vs German Russian Male Disability
COMPARE
Immigrants from Congo
German Russian
Male Disability
Male Disability Comparison
Immigrants from Congo
German Russians
11.7%
MALE DISABILITY
3.7/ 100
METRIC RATING
221st/ 347
METRIC RANK
12.0%
MALE DISABILITY
0.5/ 100
METRIC RATING
251st/ 347
METRIC RANK
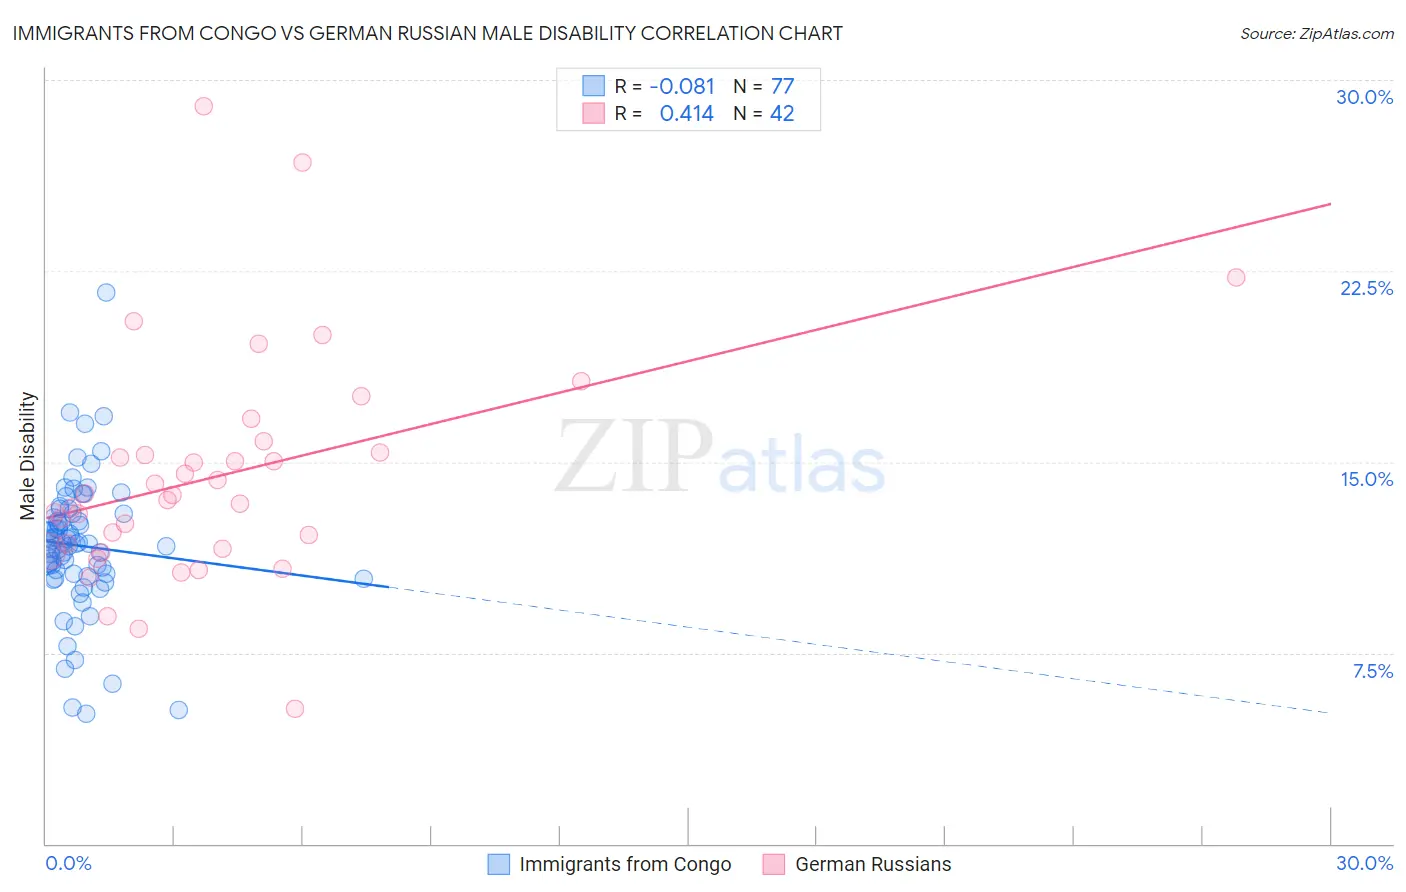
Immigrants from Congo vs German Russian Male Disability Correlation Chart
The statistical analysis conducted on geographies consisting of 92,121,223 people shows a slight negative correlation between the proportion of Immigrants from Congo and percentage of males with a disability in the United States with a correlation coefficient (R) of -0.081 and weighted average of 11.7%. Similarly, the statistical analysis conducted on geographies consisting of 96,458,633 people shows a moderate positive correlation between the proportion of German Russians and percentage of males with a disability in the United States with a correlation coefficient (R) of 0.414 and weighted average of 12.0%, a difference of 2.7%.
Male Disability Correlation Summary
| Measurement | Immigrants from Congo | German Russian |
| Minimum | 5.1% | 5.3% |
| Maximum | 21.7% | 29.0% |
| Range | 16.5% | 23.7% |
| Mean | 11.7% | 14.4% |
| Median | 11.8% | 13.6% |
| Interquartile 25% (IQ1) | 10.6% | 11.6% |
| Interquartile 75% (IQ3) | 12.9% | 15.4% |
| Interquartile Range (IQR) | 2.4% | 3.8% |
| Standard Deviation (Sample) | 2.7% | 4.5% |
| Standard Deviation (Population) | 2.6% | 4.4% |
Similar Demographics by Male Disability
Demographics Similar to Immigrants from Congo by Male Disability
In terms of male disability, the demographic groups most similar to Immigrants from Congo are Immigrants from Western Europe (11.7%, a difference of 0.010%), Panamanian (11.7%, a difference of 0.020%), Immigrants from England (11.7%, a difference of 0.080%), Alsatian (11.7%, a difference of 0.15%), and Immigrants from Bahamas (11.7%, a difference of 0.24%).
| Demographics | Rating | Rank | Male Disability |
| Lithuanians | 6.6 /100 | #214 | Tragic 11.6% |
| Indonesians | 5.9 /100 | #215 | Tragic 11.6% |
| Immigrants | Dominican Republic | 4.9 /100 | #216 | Tragic 11.7% |
| Immigrants | Dominica | 4.6 /100 | #217 | Tragic 11.7% |
| Immigrants | England | 4.0 /100 | #218 | Tragic 11.7% |
| Panamanians | 3.8 /100 | #219 | Tragic 11.7% |
| Immigrants | Western Europe | 3.8 /100 | #220 | Tragic 11.7% |
| Immigrants | Congo | 3.7 /100 | #221 | Tragic 11.7% |
| Alsatians | 3.3 /100 | #222 | Tragic 11.7% |
| Immigrants | Bahamas | 3.2 /100 | #223 | Tragic 11.7% |
| Japanese | 3.1 /100 | #224 | Tragic 11.7% |
| Liberians | 3.1 /100 | #225 | Tragic 11.8% |
| Sub-Saharan Africans | 2.8 /100 | #226 | Tragic 11.8% |
| Austrians | 2.5 /100 | #227 | Tragic 11.8% |
| Hispanics or Latinos | 2.3 /100 | #228 | Tragic 11.8% |
Demographics Similar to German Russians by Male Disability
In terms of male disability, the demographic groups most similar to German Russians are Bangladeshi (12.0%, a difference of 0.010%), Immigrants from Yemen (12.0%, a difference of 0.060%), Slovene (12.0%, a difference of 0.070%), Guamanian/Chamorro (12.0%, a difference of 0.070%), and British (12.1%, a difference of 0.26%).
| Demographics | Rating | Rank | Male Disability |
| Immigrants | Laos | 1.0 /100 | #244 | Tragic 11.9% |
| Immigrants | Liberia | 1.0 /100 | #245 | Tragic 11.9% |
| Danes | 0.9 /100 | #246 | Tragic 11.9% |
| Hungarians | 0.8 /100 | #247 | Tragic 12.0% |
| Poles | 0.7 /100 | #248 | Tragic 12.0% |
| Immigrants | Yemen | 0.5 /100 | #249 | Tragic 12.0% |
| Bangladeshis | 0.5 /100 | #250 | Tragic 12.0% |
| German Russians | 0.5 /100 | #251 | Tragic 12.0% |
| Slovenes | 0.5 /100 | #252 | Tragic 12.0% |
| Guamanians/Chamorros | 0.5 /100 | #253 | Tragic 12.0% |
| British | 0.4 /100 | #254 | Tragic 12.1% |
| Chinese | 0.4 /100 | #255 | Tragic 12.1% |
| Swiss | 0.3 /100 | #256 | Tragic 12.1% |
| Europeans | 0.3 /100 | #257 | Tragic 12.1% |
| Basques | 0.3 /100 | #258 | Tragic 12.1% |