Immigrants from Western Africa vs Chilean Male Disability
COMPARE
Immigrants from Western Africa
Chilean
Male Disability
Male Disability Comparison
Immigrants from Western Africa
Chileans
11.1%
MALE DISABILITY
69.2/ 100
METRIC RATING
157th/ 347
METRIC RANK
10.7%
MALE DISABILITY
96.9/ 100
METRIC RATING
95th/ 347
METRIC RANK
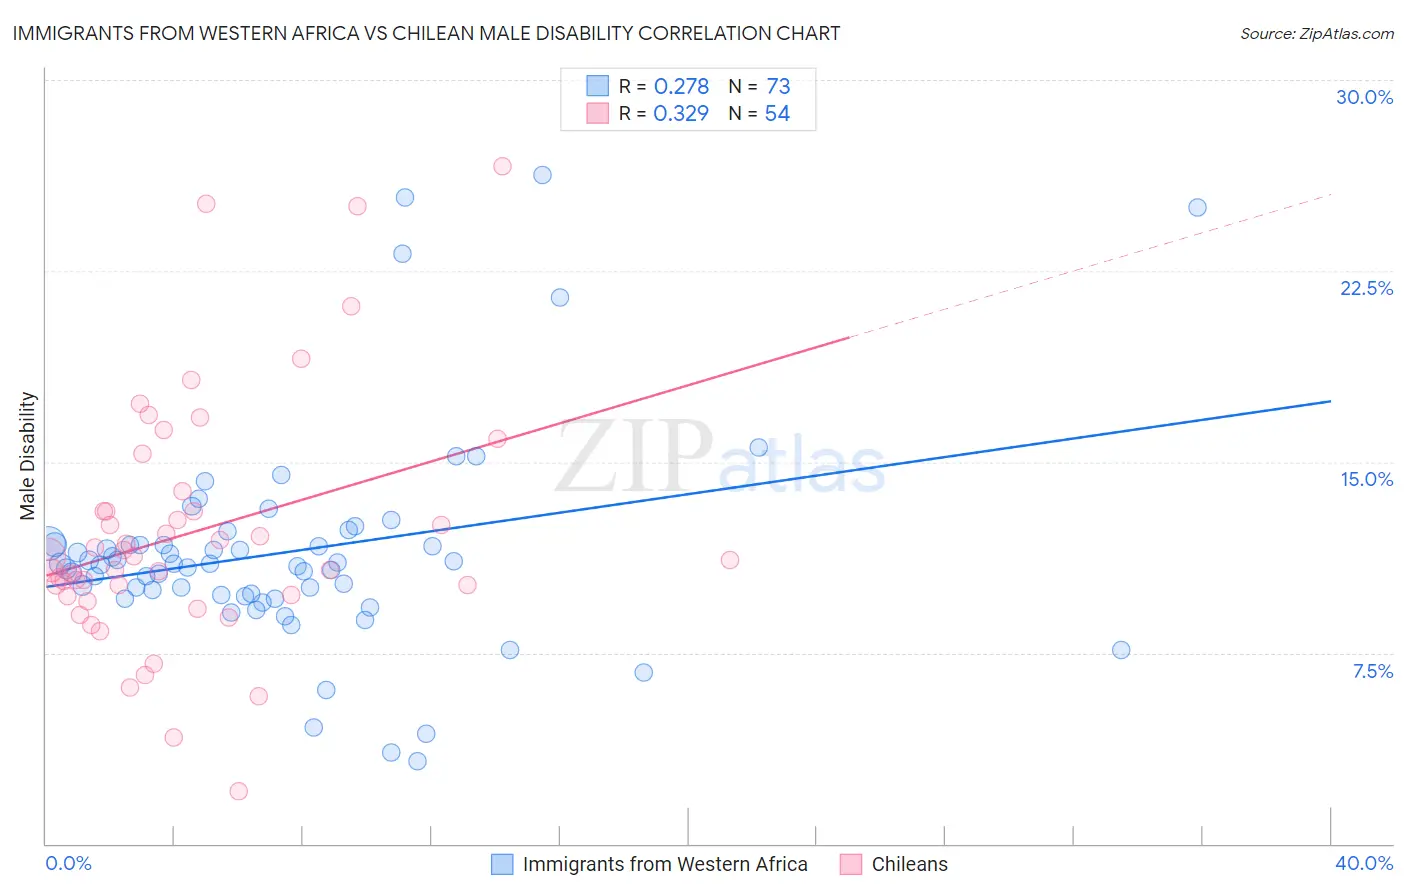
Immigrants from Western Africa vs Chilean Male Disability Correlation Chart
The statistical analysis conducted on geographies consisting of 357,781,594 people shows a weak positive correlation between the proportion of Immigrants from Western Africa and percentage of males with a disability in the United States with a correlation coefficient (R) of 0.278 and weighted average of 11.1%. Similarly, the statistical analysis conducted on geographies consisting of 256,663,212 people shows a mild positive correlation between the proportion of Chileans and percentage of males with a disability in the United States with a correlation coefficient (R) of 0.329 and weighted average of 10.7%, a difference of 3.8%.
Male Disability Correlation Summary
| Measurement | Immigrants from Western Africa | Chilean |
| Minimum | 3.3% | 2.1% |
| Maximum | 26.3% | 26.6% |
| Range | 23.0% | 24.5% |
| Mean | 11.5% | 12.2% |
| Median | 11.0% | 11.2% |
| Interquartile 25% (IQ1) | 9.8% | 9.8% |
| Interquartile 75% (IQ3) | 11.8% | 13.1% |
| Interquartile Range (IQR) | 2.0% | 3.3% |
| Standard Deviation (Sample) | 4.2% | 4.8% |
| Standard Deviation (Population) | 4.2% | 4.8% |
Similar Demographics by Male Disability
Demographics Similar to Immigrants from Western Africa by Male Disability
In terms of male disability, the demographic groups most similar to Immigrants from Western Africa are Russian (11.1%, a difference of 0.040%), Latvian (11.1%, a difference of 0.070%), Immigrants from Middle Africa (11.1%, a difference of 0.11%), Guatemalan (11.1%, a difference of 0.13%), and Albanian (11.1%, a difference of 0.18%).
| Demographics | Rating | Rank | Male Disability |
| Immigrants | Guatemala | 75.1 /100 | #150 | Good 11.0% |
| Cubans | 74.9 /100 | #151 | Good 11.0% |
| Immigrants | Albania | 74.4 /100 | #152 | Good 11.0% |
| Immigrants | Northern Europe | 73.2 /100 | #153 | Good 11.1% |
| Immigrants | Moldova | 72.8 /100 | #154 | Good 11.1% |
| Immigrants | Middle Africa | 70.9 /100 | #155 | Good 11.1% |
| Russians | 69.8 /100 | #156 | Good 11.1% |
| Immigrants | Western Africa | 69.2 /100 | #157 | Good 11.1% |
| Latvians | 68.1 /100 | #158 | Good 11.1% |
| Guatemalans | 67.2 /100 | #159 | Good 11.1% |
| Albanians | 66.5 /100 | #160 | Good 11.1% |
| Immigrants | West Indies | 65.7 /100 | #161 | Good 11.1% |
| Immigrants | Haiti | 65.3 /100 | #162 | Good 11.1% |
| Immigrants | Kenya | 63.8 /100 | #163 | Good 11.1% |
| British West Indians | 62.8 /100 | #164 | Good 11.1% |
Demographics Similar to Chileans by Male Disability
In terms of male disability, the demographic groups most similar to Chileans are Immigrants from Sweden (10.7%, a difference of 0.030%), Nicaraguan (10.7%, a difference of 0.10%), Immigrants from Armenia (10.7%, a difference of 0.12%), Immigrants from St. Vincent and the Grenadines (10.7%, a difference of 0.14%), and Immigrants from Romania (10.7%, a difference of 0.18%).
| Demographics | Rating | Rank | Male Disability |
| Immigrants | Western Asia | 97.8 /100 | #88 | Exceptional 10.6% |
| Immigrants | Nicaragua | 97.8 /100 | #89 | Exceptional 10.6% |
| Immigrants | Morocco | 97.7 /100 | #90 | Exceptional 10.6% |
| Immigrants | France | 97.6 /100 | #91 | Exceptional 10.6% |
| Palestinians | 97.4 /100 | #92 | Exceptional 10.7% |
| Immigrants | St. Vincent and the Grenadines | 97.1 /100 | #93 | Exceptional 10.7% |
| Immigrants | Sweden | 96.9 /100 | #94 | Exceptional 10.7% |
| Chileans | 96.9 /100 | #95 | Exceptional 10.7% |
| Nicaraguans | 96.6 /100 | #96 | Exceptional 10.7% |
| Immigrants | Armenia | 96.6 /100 | #97 | Exceptional 10.7% |
| Immigrants | Romania | 96.5 /100 | #98 | Exceptional 10.7% |
| Immigrants | Switzerland | 96.1 /100 | #99 | Exceptional 10.7% |
| Immigrants | Kazakhstan | 95.9 /100 | #100 | Exceptional 10.7% |
| Immigrants | Greece | 95.6 /100 | #101 | Exceptional 10.7% |
| Immigrants | Eastern Europe | 95.3 /100 | #102 | Exceptional 10.7% |