Yakama vs Chilean Male Disability
COMPARE
Yakama
Chilean
Male Disability
Male Disability Comparison
Yakama
Chileans
13.5%
MALE DISABILITY
0.0/ 100
METRIC RATING
312th/ 347
METRIC RANK
10.7%
MALE DISABILITY
96.9/ 100
METRIC RATING
95th/ 347
METRIC RANK
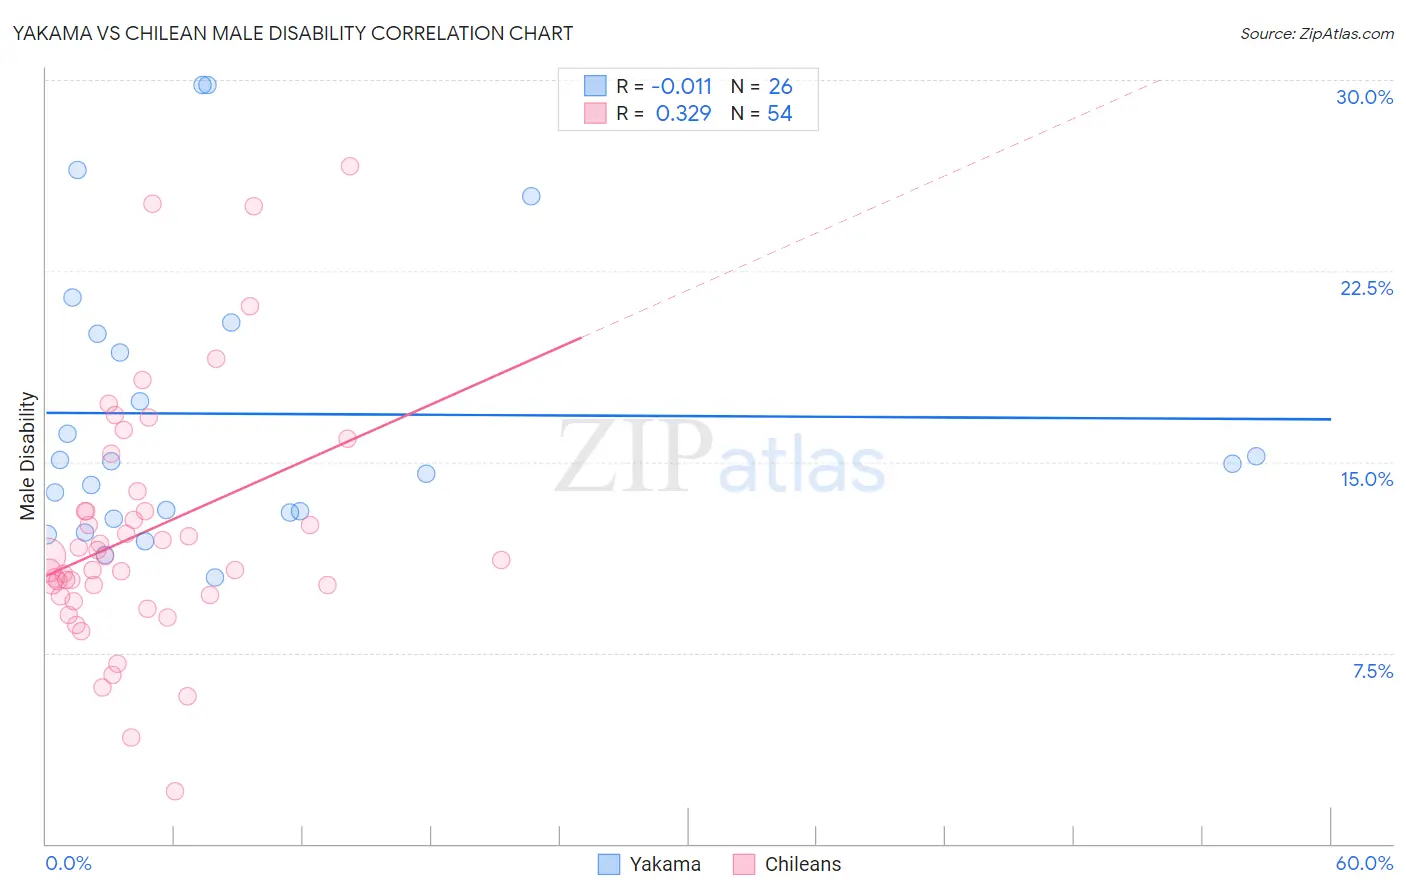
Yakama vs Chilean Male Disability Correlation Chart
The statistical analysis conducted on geographies consisting of 19,917,759 people shows no correlation between the proportion of Yakama and percentage of males with a disability in the United States with a correlation coefficient (R) of -0.011 and weighted average of 13.5%. Similarly, the statistical analysis conducted on geographies consisting of 256,663,212 people shows a mild positive correlation between the proportion of Chileans and percentage of males with a disability in the United States with a correlation coefficient (R) of 0.329 and weighted average of 10.7%, a difference of 26.7%.
Male Disability Correlation Summary
| Measurement | Yakama | Chilean |
| Minimum | 10.5% | 2.1% |
| Maximum | 29.8% | 26.6% |
| Range | 19.4% | 24.5% |
| Mean | 16.9% | 12.2% |
| Median | 15.0% | 11.2% |
| Interquartile 25% (IQ1) | 13.0% | 9.8% |
| Interquartile 75% (IQ3) | 20.0% | 13.1% |
| Interquartile Range (IQR) | 7.0% | 3.3% |
| Standard Deviation (Sample) | 5.6% | 4.8% |
| Standard Deviation (Population) | 5.5% | 4.8% |
Similar Demographics by Male Disability
Demographics Similar to Yakama by Male Disability
In terms of male disability, the demographic groups most similar to Yakama are Puget Sound Salish (13.5%, a difference of 0.020%), Aleut (13.5%, a difference of 0.080%), Iroquois (13.6%, a difference of 0.24%), Alaska Native (13.6%, a difference of 0.29%), and Delaware (13.5%, a difference of 0.55%).
| Demographics | Rating | Rank | Male Disability |
| French Canadians | 0.0 /100 | #305 | Tragic 13.3% |
| Spanish Americans | 0.0 /100 | #306 | Tragic 13.3% |
| Arapaho | 0.0 /100 | #307 | Tragic 13.3% |
| French American Indians | 0.0 /100 | #308 | Tragic 13.4% |
| Blackfeet | 0.0 /100 | #309 | Tragic 13.4% |
| Immigrants | Azores | 0.0 /100 | #310 | Tragic 13.4% |
| Delaware | 0.0 /100 | #311 | Tragic 13.5% |
| Yakama | 0.0 /100 | #312 | Tragic 13.5% |
| Puget Sound Salish | 0.0 /100 | #313 | Tragic 13.5% |
| Aleuts | 0.0 /100 | #314 | Tragic 13.5% |
| Iroquois | 0.0 /100 | #315 | Tragic 13.6% |
| Alaska Natives | 0.0 /100 | #316 | Tragic 13.6% |
| Paiute | 0.0 /100 | #317 | Tragic 13.7% |
| Cree | 0.0 /100 | #318 | Tragic 13.7% |
| Americans | 0.0 /100 | #319 | Tragic 13.8% |
Demographics Similar to Chileans by Male Disability
In terms of male disability, the demographic groups most similar to Chileans are Immigrants from Sweden (10.7%, a difference of 0.030%), Nicaraguan (10.7%, a difference of 0.10%), Immigrants from Armenia (10.7%, a difference of 0.12%), Immigrants from St. Vincent and the Grenadines (10.7%, a difference of 0.14%), and Immigrants from Romania (10.7%, a difference of 0.18%).
| Demographics | Rating | Rank | Male Disability |
| Immigrants | Western Asia | 97.8 /100 | #88 | Exceptional 10.6% |
| Immigrants | Nicaragua | 97.8 /100 | #89 | Exceptional 10.6% |
| Immigrants | Morocco | 97.7 /100 | #90 | Exceptional 10.6% |
| Immigrants | France | 97.6 /100 | #91 | Exceptional 10.6% |
| Palestinians | 97.4 /100 | #92 | Exceptional 10.7% |
| Immigrants | St. Vincent and the Grenadines | 97.1 /100 | #93 | Exceptional 10.7% |
| Immigrants | Sweden | 96.9 /100 | #94 | Exceptional 10.7% |
| Chileans | 96.9 /100 | #95 | Exceptional 10.7% |
| Nicaraguans | 96.6 /100 | #96 | Exceptional 10.7% |
| Immigrants | Armenia | 96.6 /100 | #97 | Exceptional 10.7% |
| Immigrants | Romania | 96.5 /100 | #98 | Exceptional 10.7% |
| Immigrants | Switzerland | 96.1 /100 | #99 | Exceptional 10.7% |
| Immigrants | Kazakhstan | 95.9 /100 | #100 | Exceptional 10.7% |
| Immigrants | Greece | 95.6 /100 | #101 | Exceptional 10.7% |
| Immigrants | Eastern Europe | 95.3 /100 | #102 | Exceptional 10.7% |