Immigrants from Albania vs Pakistani Self-Care Disability
COMPARE
Immigrants from Albania
Pakistani
Self-Care Disability
Self-Care Disability Comparison
Immigrants from Albania
Pakistanis
2.6%
SELF-CARE DISABILITY
0.6/ 100
METRIC RATING
247th/ 347
METRIC RANK
2.4%
SELF-CARE DISABILITY
71.4/ 100
METRIC RATING
155th/ 347
METRIC RANK
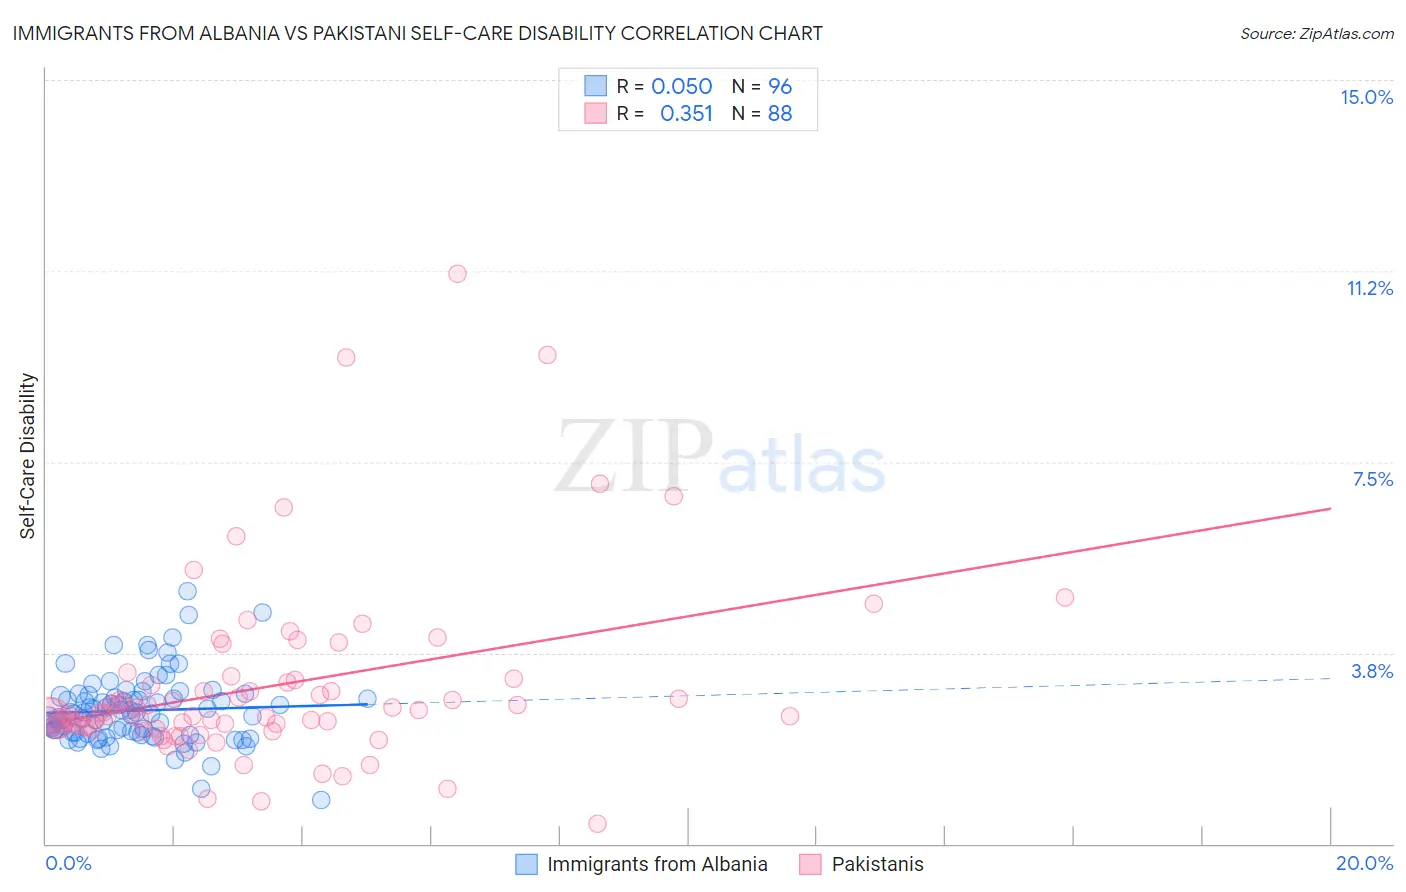
Immigrants from Albania vs Pakistani Self-Care Disability Correlation Chart
The statistical analysis conducted on geographies consisting of 119,364,841 people shows a slight positive correlation between the proportion of Immigrants from Albania and percentage of population with self-care disability in the United States with a correlation coefficient (R) of 0.050 and weighted average of 2.6%. Similarly, the statistical analysis conducted on geographies consisting of 334,999,901 people shows a mild positive correlation between the proportion of Pakistanis and percentage of population with self-care disability in the United States with a correlation coefficient (R) of 0.351 and weighted average of 2.4%, a difference of 7.3%.
Self-Care Disability Correlation Summary
| Measurement | Immigrants from Albania | Pakistani |
| Minimum | 0.86% | 0.40% |
| Maximum | 5.0% | 11.2% |
| Range | 4.1% | 10.8% |
| Mean | 2.6% | 3.1% |
| Median | 2.5% | 2.5% |
| Interquartile 25% (IQ1) | 2.2% | 2.3% |
| Interquartile 75% (IQ3) | 2.9% | 3.2% |
| Interquartile Range (IQR) | 0.70% | 0.89% |
| Standard Deviation (Sample) | 0.68% | 1.8% |
| Standard Deviation (Population) | 0.67% | 1.8% |
Similar Demographics by Self-Care Disability
Demographics Similar to Immigrants from Albania by Self-Care Disability
In terms of self-care disability, the demographic groups most similar to Immigrants from Albania are Nicaraguan (2.6%, a difference of 0.0%), Cheyenne (2.6%, a difference of 0.13%), Immigrants from Western Asia (2.6%, a difference of 0.15%), Mexican American Indian (2.6%, a difference of 0.24%), and Portuguese (2.6%, a difference of 0.32%).
| Demographics | Rating | Rank | Self-Care Disability |
| Marshallese | 1.2 /100 | #240 | Tragic 2.6% |
| Immigrants | Syria | 1.0 /100 | #241 | Tragic 2.6% |
| Spanish | 0.8 /100 | #242 | Tragic 2.6% |
| Hawaiians | 0.8 /100 | #243 | Tragic 2.6% |
| Yuman | 0.8 /100 | #244 | Tragic 2.6% |
| Immigrants | Western Asia | 0.6 /100 | #245 | Tragic 2.6% |
| Cheyenne | 0.6 /100 | #246 | Tragic 2.6% |
| Immigrants | Albania | 0.6 /100 | #247 | Tragic 2.6% |
| Nicaraguans | 0.6 /100 | #248 | Tragic 2.6% |
| Mexican American Indians | 0.5 /100 | #249 | Tragic 2.6% |
| Portuguese | 0.4 /100 | #250 | Tragic 2.6% |
| Immigrants | Liberia | 0.4 /100 | #251 | Tragic 2.6% |
| Immigrants | Bangladesh | 0.4 /100 | #252 | Tragic 2.6% |
| Immigrants | Haiti | 0.3 /100 | #253 | Tragic 2.6% |
| Haitians | 0.3 /100 | #254 | Tragic 2.6% |
Demographics Similar to Pakistanis by Self-Care Disability
In terms of self-care disability, the demographic groups most similar to Pakistanis are Italian (2.4%, a difference of 0.050%), Nigerian (2.4%, a difference of 0.050%), Immigrants from Europe (2.4%, a difference of 0.11%), Immigrants from England (2.4%, a difference of 0.12%), and Tlingit-Haida (2.4%, a difference of 0.13%).
| Demographics | Rating | Rank | Self-Care Disability |
| Romanians | 75.8 /100 | #148 | Good 2.4% |
| Arabs | 75.7 /100 | #149 | Good 2.4% |
| Immigrants | Costa Rica | 75.1 /100 | #150 | Good 2.4% |
| Basques | 74.0 /100 | #151 | Good 2.4% |
| Tlingit-Haida | 73.5 /100 | #152 | Good 2.4% |
| Immigrants | England | 73.5 /100 | #153 | Good 2.4% |
| Italians | 72.2 /100 | #154 | Good 2.4% |
| Pakistanis | 71.4 /100 | #155 | Good 2.4% |
| Nigerians | 70.6 /100 | #156 | Good 2.4% |
| Immigrants | Europe | 69.6 /100 | #157 | Good 2.4% |
| Immigrants | Western Europe | 68.6 /100 | #158 | Good 2.4% |
| Immigrants | Italy | 68.5 /100 | #159 | Good 2.4% |
| Finns | 67.0 /100 | #160 | Good 2.4% |
| Lebanese | 66.5 /100 | #161 | Good 2.4% |
| Somalis | 63.7 /100 | #162 | Good 2.5% |