Trinidadian and Tobagonian vs Pakistani Self-Care Disability
COMPARE
Trinidadian and Tobagonian
Pakistani
Self-Care Disability
Self-Care Disability Comparison
Trinidadians and Tobagonians
Pakistanis
2.7%
SELF-CARE DISABILITY
0.1/ 100
METRIC RATING
271st/ 347
METRIC RANK
2.4%
SELF-CARE DISABILITY
71.4/ 100
METRIC RATING
155th/ 347
METRIC RANK
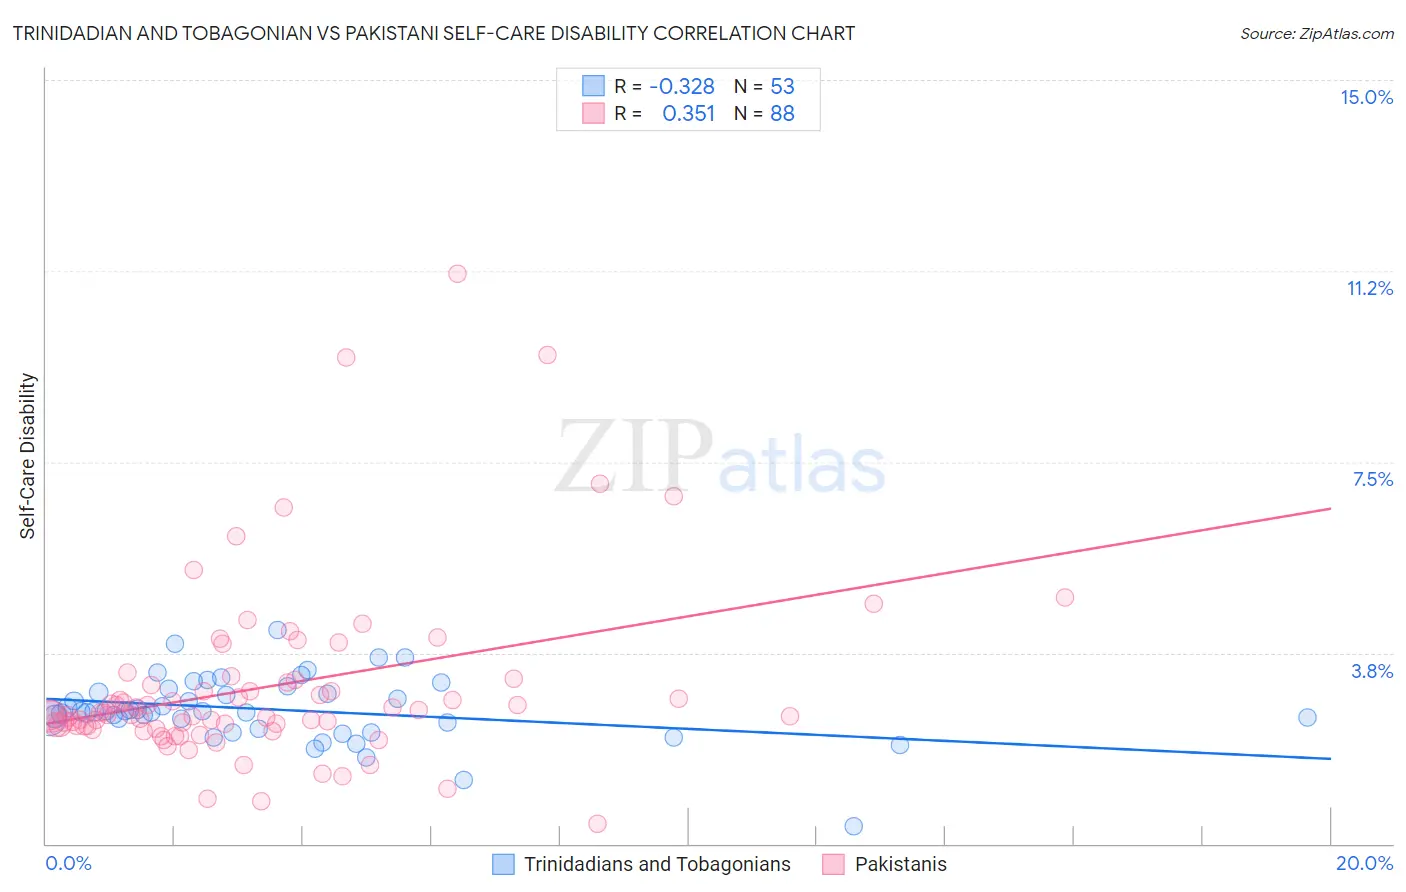
Trinidadian and Tobagonian vs Pakistani Self-Care Disability Correlation Chart
The statistical analysis conducted on geographies consisting of 219,630,331 people shows a mild negative correlation between the proportion of Trinidadians and Tobagonians and percentage of population with self-care disability in the United States with a correlation coefficient (R) of -0.328 and weighted average of 2.7%. Similarly, the statistical analysis conducted on geographies consisting of 334,999,901 people shows a mild positive correlation between the proportion of Pakistanis and percentage of population with self-care disability in the United States with a correlation coefficient (R) of 0.351 and weighted average of 2.4%, a difference of 9.5%.
Self-Care Disability Correlation Summary
| Measurement | Trinidadian and Tobagonian | Pakistani |
| Minimum | 0.34% | 0.40% |
| Maximum | 4.2% | 11.2% |
| Range | 3.9% | 10.8% |
| Mean | 2.6% | 3.1% |
| Median | 2.6% | 2.5% |
| Interquartile 25% (IQ1) | 2.3% | 2.3% |
| Interquartile 75% (IQ3) | 3.0% | 3.2% |
| Interquartile Range (IQR) | 0.69% | 0.89% |
| Standard Deviation (Sample) | 0.64% | 1.8% |
| Standard Deviation (Population) | 0.64% | 1.8% |
Similar Demographics by Self-Care Disability
Demographics Similar to Trinidadians and Tobagonians by Self-Care Disability
In terms of self-care disability, the demographic groups most similar to Trinidadians and Tobagonians are Immigrants from Laos (2.7%, a difference of 0.040%), Immigrants from Micronesia (2.7%, a difference of 0.060%), U.S. Virgin Islander (2.7%, a difference of 0.10%), Mexican (2.7%, a difference of 0.18%), and Yakama (2.7%, a difference of 0.24%).
| Demographics | Rating | Rank | Self-Care Disability |
| Immigrants | Iran | 0.2 /100 | #264 | Tragic 2.7% |
| Immigrants | Nicaragua | 0.2 /100 | #265 | Tragic 2.7% |
| Immigrants | Cambodia | 0.1 /100 | #266 | Tragic 2.7% |
| Yaqui | 0.1 /100 | #267 | Tragic 2.7% |
| Immigrants | Mexico | 0.1 /100 | #268 | Tragic 2.7% |
| U.S. Virgin Islanders | 0.1 /100 | #269 | Tragic 2.7% |
| Immigrants | Micronesia | 0.1 /100 | #270 | Tragic 2.7% |
| Trinidadians and Tobagonians | 0.1 /100 | #271 | Tragic 2.7% |
| Immigrants | Laos | 0.1 /100 | #272 | Tragic 2.7% |
| Mexicans | 0.1 /100 | #273 | Tragic 2.7% |
| Yakama | 0.1 /100 | #274 | Tragic 2.7% |
| Immigrants | Trinidad and Tobago | 0.1 /100 | #275 | Tragic 2.7% |
| Japanese | 0.1 /100 | #276 | Tragic 2.7% |
| Immigrants | Ukraine | 0.1 /100 | #277 | Tragic 2.7% |
| Ottawa | 0.1 /100 | #278 | Tragic 2.7% |
Demographics Similar to Pakistanis by Self-Care Disability
In terms of self-care disability, the demographic groups most similar to Pakistanis are Italian (2.4%, a difference of 0.050%), Nigerian (2.4%, a difference of 0.050%), Immigrants from Europe (2.4%, a difference of 0.11%), Immigrants from England (2.4%, a difference of 0.12%), and Tlingit-Haida (2.4%, a difference of 0.13%).
| Demographics | Rating | Rank | Self-Care Disability |
| Romanians | 75.8 /100 | #148 | Good 2.4% |
| Arabs | 75.7 /100 | #149 | Good 2.4% |
| Immigrants | Costa Rica | 75.1 /100 | #150 | Good 2.4% |
| Basques | 74.0 /100 | #151 | Good 2.4% |
| Tlingit-Haida | 73.5 /100 | #152 | Good 2.4% |
| Immigrants | England | 73.5 /100 | #153 | Good 2.4% |
| Italians | 72.2 /100 | #154 | Good 2.4% |
| Pakistanis | 71.4 /100 | #155 | Good 2.4% |
| Nigerians | 70.6 /100 | #156 | Good 2.4% |
| Immigrants | Europe | 69.6 /100 | #157 | Good 2.4% |
| Immigrants | Western Europe | 68.6 /100 | #158 | Good 2.4% |
| Immigrants | Italy | 68.5 /100 | #159 | Good 2.4% |
| Finns | 67.0 /100 | #160 | Good 2.4% |
| Lebanese | 66.5 /100 | #161 | Good 2.4% |
| Somalis | 63.7 /100 | #162 | Good 2.5% |