Immigrants from Cabo Verde vs Pakistani Self-Care Disability
COMPARE
Immigrants from Cabo Verde
Pakistani
Self-Care Disability
Self-Care Disability Comparison
Immigrants from Cabo Verde
Pakistanis
3.1%
SELF-CARE DISABILITY
0.0/ 100
METRIC RATING
340th/ 347
METRIC RANK
2.4%
SELF-CARE DISABILITY
71.4/ 100
METRIC RATING
155th/ 347
METRIC RANK
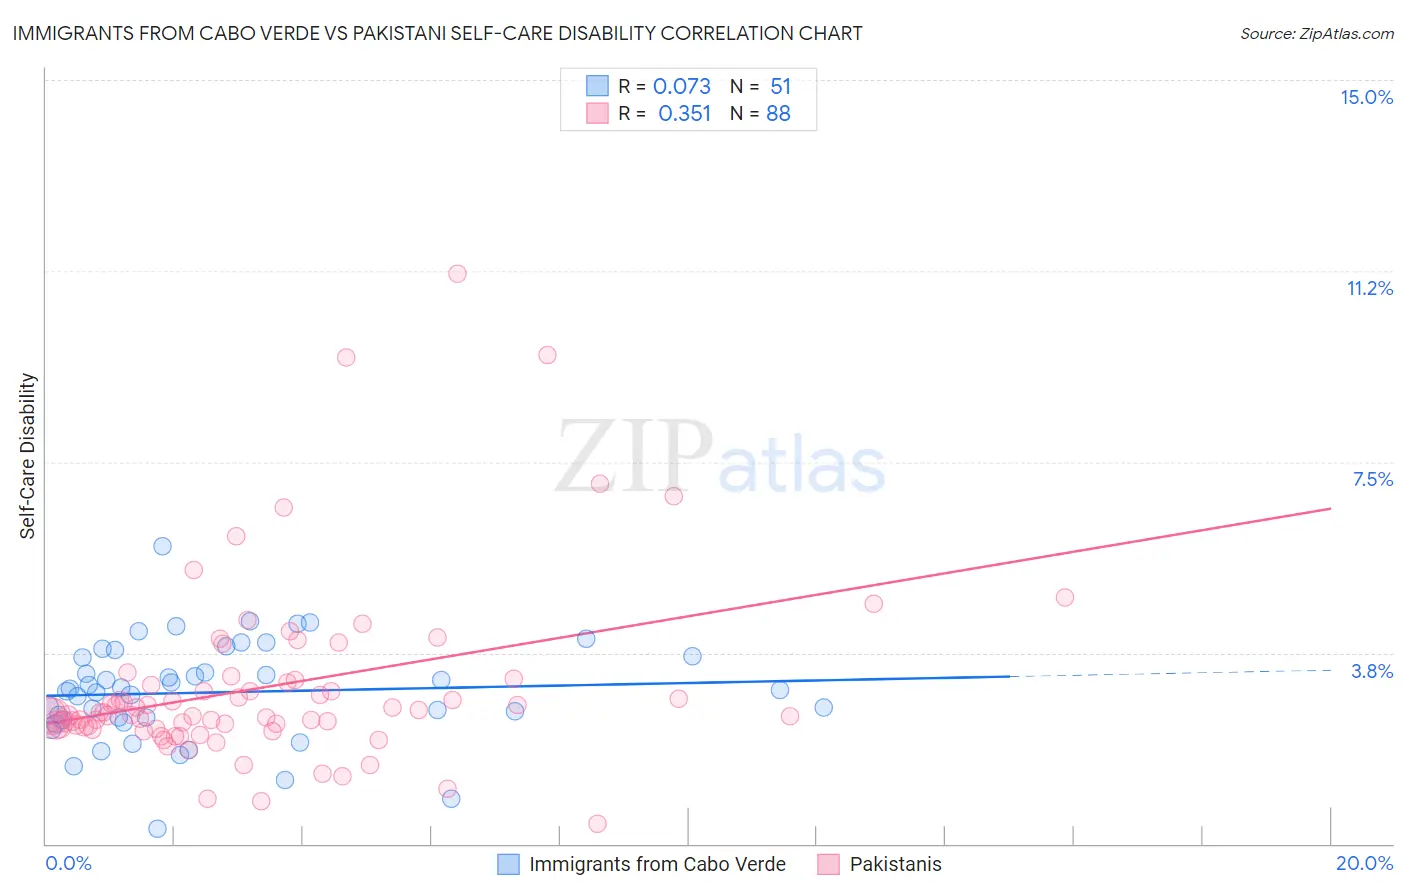
Immigrants from Cabo Verde vs Pakistani Self-Care Disability Correlation Chart
The statistical analysis conducted on geographies consisting of 38,125,014 people shows a slight positive correlation between the proportion of Immigrants from Cabo Verde and percentage of population with self-care disability in the United States with a correlation coefficient (R) of 0.073 and weighted average of 3.1%. Similarly, the statistical analysis conducted on geographies consisting of 334,999,901 people shows a mild positive correlation between the proportion of Pakistanis and percentage of population with self-care disability in the United States with a correlation coefficient (R) of 0.351 and weighted average of 2.4%, a difference of 25.2%.
Self-Care Disability Correlation Summary
| Measurement | Immigrants from Cabo Verde | Pakistani |
| Minimum | 0.30% | 0.40% |
| Maximum | 5.8% | 11.2% |
| Range | 5.5% | 10.8% |
| Mean | 3.0% | 3.1% |
| Median | 3.0% | 2.5% |
| Interquartile 25% (IQ1) | 2.4% | 2.3% |
| Interquartile 75% (IQ3) | 3.7% | 3.2% |
| Interquartile Range (IQR) | 1.2% | 0.89% |
| Standard Deviation (Sample) | 1.00% | 1.8% |
| Standard Deviation (Population) | 0.99% | 1.8% |
Similar Demographics by Self-Care Disability
Demographics Similar to Immigrants from Cabo Verde by Self-Care Disability
In terms of self-care disability, the demographic groups most similar to Immigrants from Cabo Verde are Dominican (3.1%, a difference of 0.26%), Immigrants from Dominican Republic (3.0%, a difference of 0.33%), Cape Verdean (3.0%, a difference of 0.72%), Choctaw (3.0%, a difference of 1.0%), and Colville (3.1%, a difference of 1.9%).
| Demographics | Rating | Rank | Self-Care Disability |
| Dutch West Indians | 0.0 /100 | #333 | Tragic 3.0% |
| Houma | 0.0 /100 | #334 | Tragic 3.0% |
| Immigrants | Azores | 0.0 /100 | #335 | Tragic 3.0% |
| Immigrants | Yemen | 0.0 /100 | #336 | Tragic 3.0% |
| Choctaw | 0.0 /100 | #337 | Tragic 3.0% |
| Cape Verdeans | 0.0 /100 | #338 | Tragic 3.0% |
| Immigrants | Dominican Republic | 0.0 /100 | #339 | Tragic 3.0% |
| Immigrants | Cabo Verde | 0.0 /100 | #340 | Tragic 3.1% |
| Dominicans | 0.0 /100 | #341 | Tragic 3.1% |
| Colville | 0.0 /100 | #342 | Tragic 3.1% |
| Tohono O'odham | 0.0 /100 | #343 | Tragic 3.1% |
| Pueblo | 0.0 /100 | #344 | Tragic 3.3% |
| Armenians | 0.0 /100 | #345 | Tragic 3.4% |
| Puerto Ricans | 0.0 /100 | #346 | Tragic 3.7% |
| Immigrants | Armenia | 0.0 /100 | #347 | Tragic 4.2% |
Demographics Similar to Pakistanis by Self-Care Disability
In terms of self-care disability, the demographic groups most similar to Pakistanis are Italian (2.4%, a difference of 0.050%), Nigerian (2.4%, a difference of 0.050%), Immigrants from Europe (2.4%, a difference of 0.11%), Immigrants from England (2.4%, a difference of 0.12%), and Tlingit-Haida (2.4%, a difference of 0.13%).
| Demographics | Rating | Rank | Self-Care Disability |
| Romanians | 75.8 /100 | #148 | Good 2.4% |
| Arabs | 75.7 /100 | #149 | Good 2.4% |
| Immigrants | Costa Rica | 75.1 /100 | #150 | Good 2.4% |
| Basques | 74.0 /100 | #151 | Good 2.4% |
| Tlingit-Haida | 73.5 /100 | #152 | Good 2.4% |
| Immigrants | England | 73.5 /100 | #153 | Good 2.4% |
| Italians | 72.2 /100 | #154 | Good 2.4% |
| Pakistanis | 71.4 /100 | #155 | Good 2.4% |
| Nigerians | 70.6 /100 | #156 | Good 2.4% |
| Immigrants | Europe | 69.6 /100 | #157 | Good 2.4% |
| Immigrants | Western Europe | 68.6 /100 | #158 | Good 2.4% |
| Immigrants | Italy | 68.5 /100 | #159 | Good 2.4% |
| Finns | 67.0 /100 | #160 | Good 2.4% |
| Lebanese | 66.5 /100 | #161 | Good 2.4% |
| Somalis | 63.7 /100 | #162 | Good 2.5% |