Navajo vs Serbian Male Disability
COMPARE
Navajo
Serbian
Male Disability
Male Disability Comparison
Navajo
Serbians
14.4%
MALE DISABILITY
0.0/ 100
METRIC RATING
330th/ 347
METRIC RANK
11.5%
MALE DISABILITY
10.7/ 100
METRIC RATING
205th/ 347
METRIC RANK
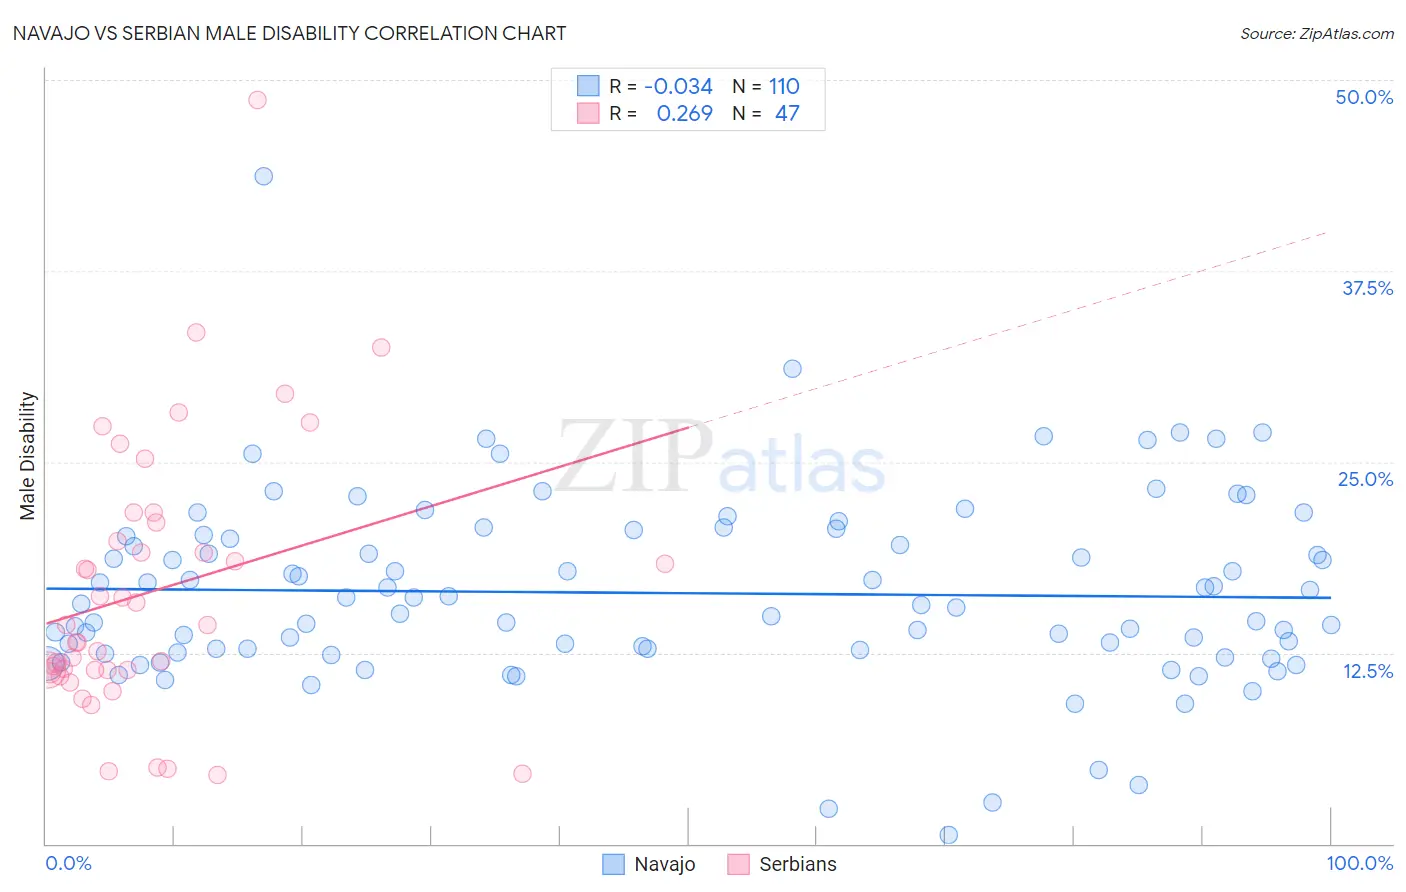
Navajo vs Serbian Male Disability Correlation Chart
The statistical analysis conducted on geographies consisting of 224,784,363 people shows no correlation between the proportion of Navajo and percentage of males with a disability in the United States with a correlation coefficient (R) of -0.034 and weighted average of 14.4%. Similarly, the statistical analysis conducted on geographies consisting of 267,640,230 people shows a weak positive correlation between the proportion of Serbians and percentage of males with a disability in the United States with a correlation coefficient (R) of 0.269 and weighted average of 11.5%, a difference of 24.7%.
Male Disability Correlation Summary
| Measurement | Navajo | Serbian |
| Minimum | 0.60% | 4.5% |
| Maximum | 43.7% | 48.7% |
| Range | 43.1% | 44.3% |
| Mean | 16.4% | 16.6% |
| Median | 15.6% | 14.3% |
| Interquartile 25% (IQ1) | 12.7% | 11.3% |
| Interquartile 75% (IQ3) | 20.1% | 21.0% |
| Interquartile Range (IQR) | 7.5% | 9.7% |
| Standard Deviation (Sample) | 6.1% | 8.8% |
| Standard Deviation (Population) | 6.1% | 8.8% |
Similar Demographics by Male Disability
Demographics Similar to Navajo by Male Disability
In terms of male disability, the demographic groups most similar to Navajo are Cajun (14.4%, a difference of 0.23%), Chippewa (14.3%, a difference of 0.81%), Potawatomi (14.2%, a difference of 1.2%), Native/Alaskan (14.2%, a difference of 1.3%), and Tohono O'odham (14.6%, a difference of 1.5%).
| Demographics | Rating | Rank | Male Disability |
| Osage | 0.0 /100 | #323 | Tragic 14.0% |
| Comanche | 0.0 /100 | #324 | Tragic 14.1% |
| Ottawa | 0.0 /100 | #325 | Tragic 14.1% |
| Natives/Alaskans | 0.0 /100 | #326 | Tragic 14.2% |
| Potawatomi | 0.0 /100 | #327 | Tragic 14.2% |
| Chippewa | 0.0 /100 | #328 | Tragic 14.3% |
| Cajuns | 0.0 /100 | #329 | Tragic 14.4% |
| Navajo | 0.0 /100 | #330 | Tragic 14.4% |
| Tohono O'odham | 0.0 /100 | #331 | Tragic 14.6% |
| Seminole | 0.0 /100 | #332 | Tragic 14.7% |
| Yuman | 0.0 /100 | #333 | Tragic 14.7% |
| Cherokee | 0.0 /100 | #334 | Tragic 14.8% |
| Dutch West Indians | 0.0 /100 | #335 | Tragic 14.8% |
| Alaskan Athabascans | 0.0 /100 | #336 | Tragic 14.9% |
| Menominee | 0.0 /100 | #337 | Tragic 15.0% |
Demographics Similar to Serbians by Male Disability
In terms of male disability, the demographic groups most similar to Serbians are Immigrants from Cambodia (11.5%, a difference of 0.0%), Ukrainian (11.5%, a difference of 0.010%), Jamaican (11.5%, a difference of 0.020%), Immigrants from Somalia (11.5%, a difference of 0.040%), and Icelander (11.6%, a difference of 0.080%).
| Demographics | Rating | Rank | Male Disability |
| Immigrants | Jamaica | 16.3 /100 | #198 | Poor 11.5% |
| Lebanese | 15.4 /100 | #199 | Poor 11.5% |
| Immigrants | Iraq | 13.0 /100 | #200 | Poor 11.5% |
| Immigrants | Panama | 13.0 /100 | #201 | Poor 11.5% |
| Immigrants | Mexico | 12.6 /100 | #202 | Poor 11.5% |
| Jamaicans | 10.9 /100 | #203 | Poor 11.5% |
| Immigrants | Cambodia | 10.8 /100 | #204 | Poor 11.5% |
| Serbians | 10.7 /100 | #205 | Poor 11.5% |
| Ukrainians | 10.6 /100 | #206 | Poor 11.5% |
| Immigrants | Somalia | 10.4 /100 | #207 | Poor 11.5% |
| Icelanders | 10.1 /100 | #208 | Poor 11.6% |
| Spanish American Indians | 10.1 /100 | #209 | Poor 11.6% |
| Ute | 9.4 /100 | #210 | Tragic 11.6% |
| Immigrants | Thailand | 8.4 /100 | #211 | Tragic 11.6% |
| Immigrants | Scotland | 8.2 /100 | #212 | Tragic 11.6% |