Navajo vs Somali Male Disability
COMPARE
Navajo
Somali
Male Disability
Male Disability Comparison
Navajo
Somalis
14.4%
MALE DISABILITY
0.0/ 100
METRIC RATING
330th/ 347
METRIC RANK
11.4%
MALE DISABILITY
18.2/ 100
METRIC RATING
197th/ 347
METRIC RANK
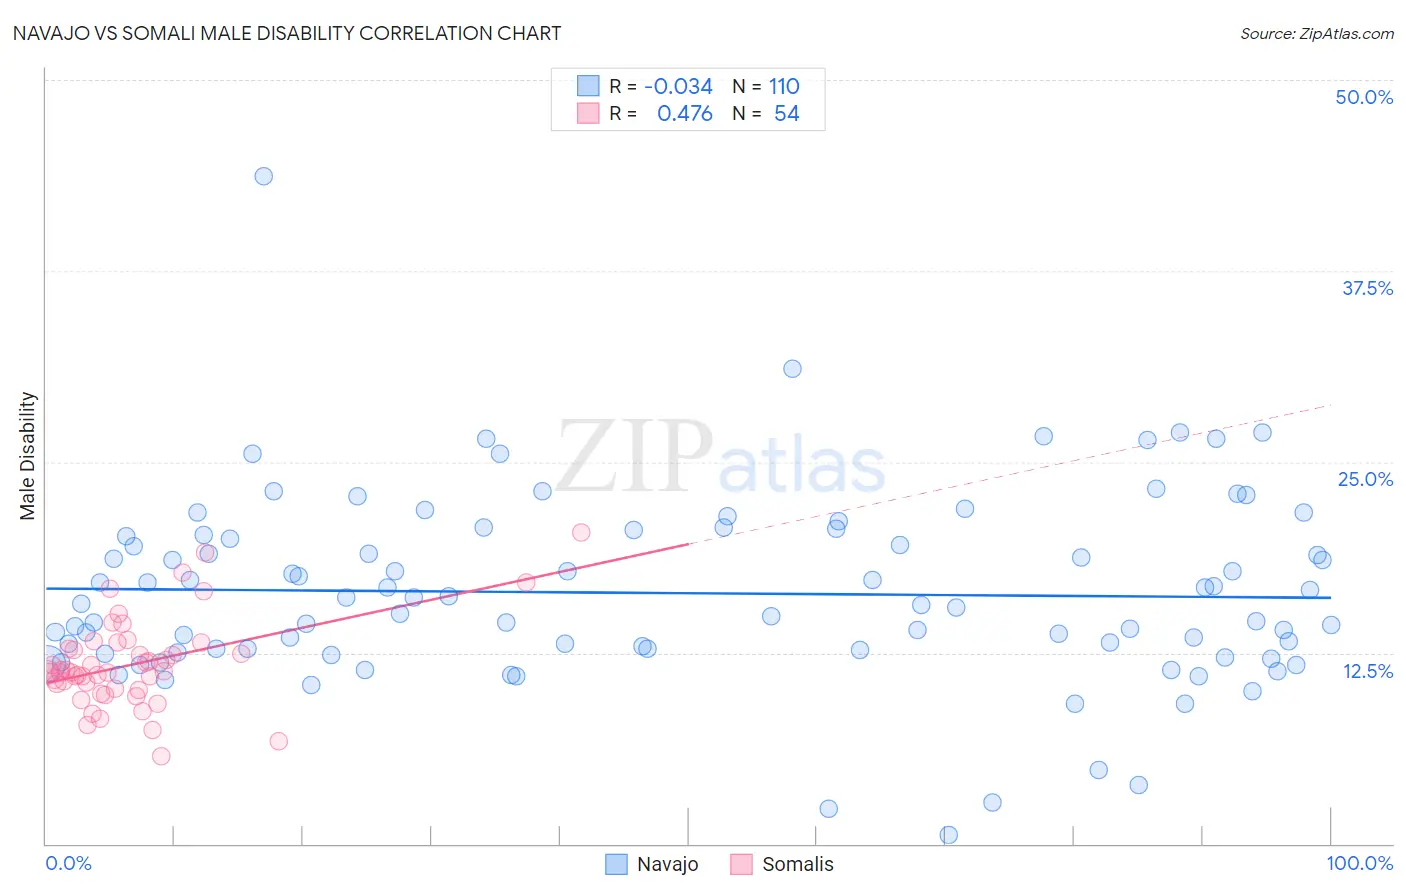
Navajo vs Somali Male Disability Correlation Chart
The statistical analysis conducted on geographies consisting of 224,784,363 people shows no correlation between the proportion of Navajo and percentage of males with a disability in the United States with a correlation coefficient (R) of -0.034 and weighted average of 14.4%. Similarly, the statistical analysis conducted on geographies consisting of 99,314,989 people shows a moderate positive correlation between the proportion of Somalis and percentage of males with a disability in the United States with a correlation coefficient (R) of 0.476 and weighted average of 11.4%, a difference of 25.7%.
Male Disability Correlation Summary
| Measurement | Navajo | Somali |
| Minimum | 0.60% | 5.7% |
| Maximum | 43.7% | 20.4% |
| Range | 43.1% | 14.6% |
| Mean | 16.4% | 11.8% |
| Median | 15.6% | 11.2% |
| Interquartile 25% (IQ1) | 12.7% | 10.1% |
| Interquartile 75% (IQ3) | 20.1% | 12.7% |
| Interquartile Range (IQR) | 7.5% | 2.6% |
| Standard Deviation (Sample) | 6.1% | 2.9% |
| Standard Deviation (Population) | 6.1% | 2.9% |
Similar Demographics by Male Disability
Demographics Similar to Navajo by Male Disability
In terms of male disability, the demographic groups most similar to Navajo are Cajun (14.4%, a difference of 0.23%), Chippewa (14.3%, a difference of 0.81%), Potawatomi (14.2%, a difference of 1.2%), Native/Alaskan (14.2%, a difference of 1.3%), and Tohono O'odham (14.6%, a difference of 1.5%).
| Demographics | Rating | Rank | Male Disability |
| Osage | 0.0 /100 | #323 | Tragic 14.0% |
| Comanche | 0.0 /100 | #324 | Tragic 14.1% |
| Ottawa | 0.0 /100 | #325 | Tragic 14.1% |
| Natives/Alaskans | 0.0 /100 | #326 | Tragic 14.2% |
| Potawatomi | 0.0 /100 | #327 | Tragic 14.2% |
| Chippewa | 0.0 /100 | #328 | Tragic 14.3% |
| Cajuns | 0.0 /100 | #329 | Tragic 14.4% |
| Navajo | 0.0 /100 | #330 | Tragic 14.4% |
| Tohono O'odham | 0.0 /100 | #331 | Tragic 14.6% |
| Seminole | 0.0 /100 | #332 | Tragic 14.7% |
| Yuman | 0.0 /100 | #333 | Tragic 14.7% |
| Cherokee | 0.0 /100 | #334 | Tragic 14.8% |
| Dutch West Indians | 0.0 /100 | #335 | Tragic 14.8% |
| Alaskan Athabascans | 0.0 /100 | #336 | Tragic 14.9% |
| Menominee | 0.0 /100 | #337 | Tragic 15.0% |
Demographics Similar to Somalis by Male Disability
In terms of male disability, the demographic groups most similar to Somalis are West Indian (11.4%, a difference of 0.020%), Immigrants from Jamaica (11.5%, a difference of 0.18%), Immigrants from Oceania (11.4%, a difference of 0.23%), Belizean (11.4%, a difference of 0.26%), and Lebanese (11.5%, a difference of 0.27%).
| Demographics | Rating | Rank | Male Disability |
| Immigrants | Bosnia and Herzegovina | 25.4 /100 | #190 | Fair 11.4% |
| Senegalese | 23.2 /100 | #191 | Fair 11.4% |
| Assyrians/Chaldeans/Syriacs | 23.2 /100 | #192 | Fair 11.4% |
| Greeks | 22.2 /100 | #193 | Fair 11.4% |
| Belizeans | 21.2 /100 | #194 | Fair 11.4% |
| Immigrants | Oceania | 20.9 /100 | #195 | Fair 11.4% |
| West Indians | 18.4 /100 | #196 | Poor 11.4% |
| Somalis | 18.2 /100 | #197 | Poor 11.4% |
| Immigrants | Jamaica | 16.3 /100 | #198 | Poor 11.5% |
| Lebanese | 15.4 /100 | #199 | Poor 11.5% |
| Immigrants | Iraq | 13.0 /100 | #200 | Poor 11.5% |
| Immigrants | Panama | 13.0 /100 | #201 | Poor 11.5% |
| Immigrants | Mexico | 12.6 /100 | #202 | Poor 11.5% |
| Jamaicans | 10.9 /100 | #203 | Poor 11.5% |
| Immigrants | Cambodia | 10.8 /100 | #204 | Poor 11.5% |