Navajo vs French Canadian Male Disability
COMPARE
Navajo
French Canadian
Male Disability
Male Disability Comparison
Navajo
French Canadians
14.4%
MALE DISABILITY
0.0/ 100
METRIC RATING
330th/ 347
METRIC RANK
13.3%
MALE DISABILITY
0.0/ 100
METRIC RATING
305th/ 347
METRIC RANK
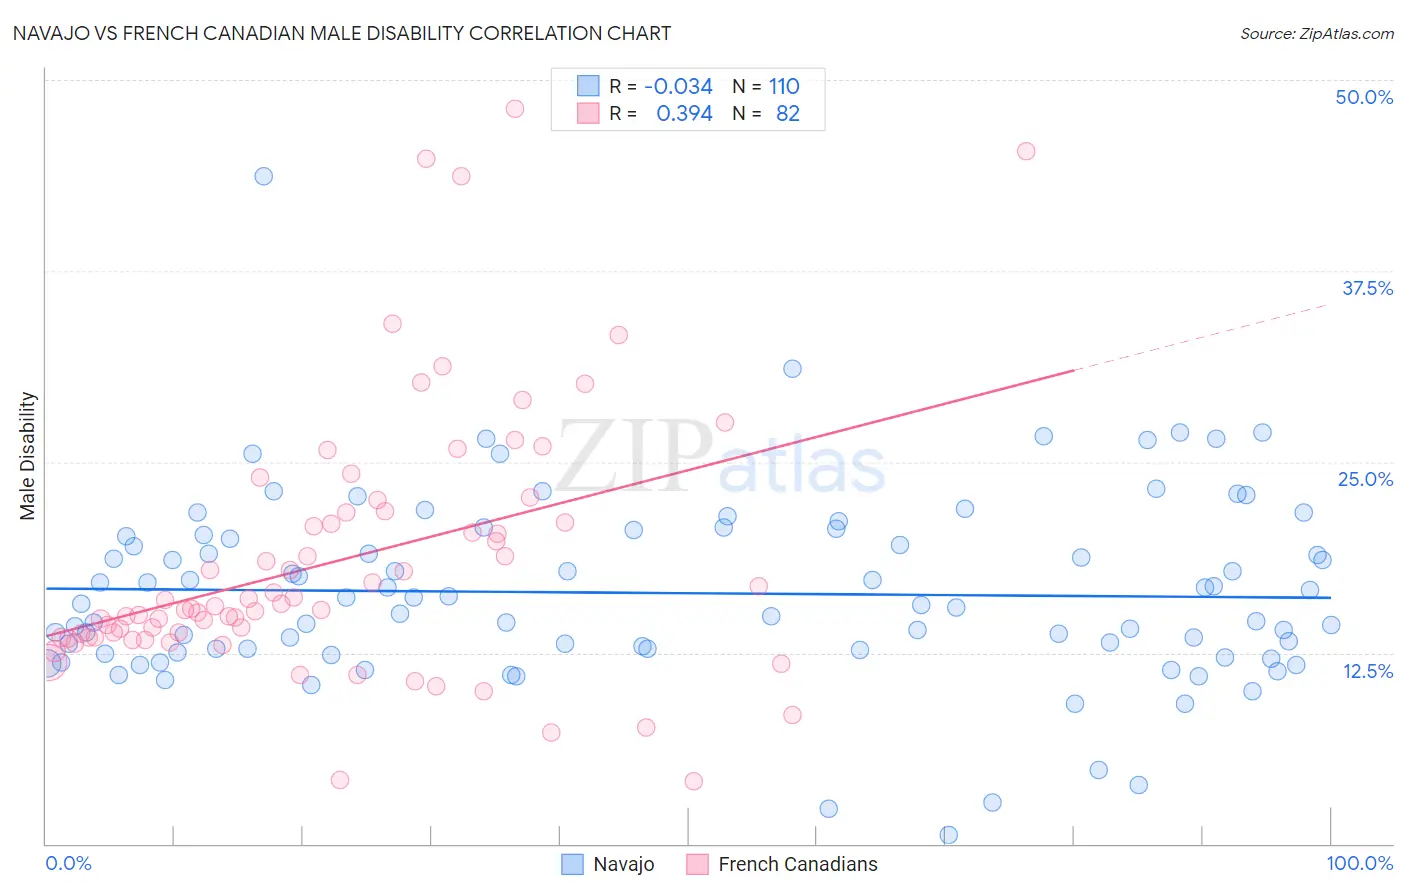
Navajo vs French Canadian Male Disability Correlation Chart
The statistical analysis conducted on geographies consisting of 224,784,363 people shows no correlation between the proportion of Navajo and percentage of males with a disability in the United States with a correlation coefficient (R) of -0.034 and weighted average of 14.4%. Similarly, the statistical analysis conducted on geographies consisting of 502,511,439 people shows a mild positive correlation between the proportion of French Canadians and percentage of males with a disability in the United States with a correlation coefficient (R) of 0.394 and weighted average of 13.3%, a difference of 8.4%.
Male Disability Correlation Summary
| Measurement | Navajo | French Canadian |
| Minimum | 0.60% | 4.1% |
| Maximum | 43.7% | 48.1% |
| Range | 43.1% | 44.0% |
| Mean | 16.4% | 18.5% |
| Median | 15.6% | 15.5% |
| Interquartile 25% (IQ1) | 12.7% | 13.5% |
| Interquartile 75% (IQ3) | 20.1% | 21.7% |
| Interquartile Range (IQR) | 7.5% | 8.2% |
| Standard Deviation (Sample) | 6.1% | 8.7% |
| Standard Deviation (Population) | 6.1% | 8.7% |
Similar Demographics by Male Disability
Demographics Similar to Navajo by Male Disability
In terms of male disability, the demographic groups most similar to Navajo are Cajun (14.4%, a difference of 0.23%), Chippewa (14.3%, a difference of 0.81%), Potawatomi (14.2%, a difference of 1.2%), Native/Alaskan (14.2%, a difference of 1.3%), and Tohono O'odham (14.6%, a difference of 1.5%).
| Demographics | Rating | Rank | Male Disability |
| Osage | 0.0 /100 | #323 | Tragic 14.0% |
| Comanche | 0.0 /100 | #324 | Tragic 14.1% |
| Ottawa | 0.0 /100 | #325 | Tragic 14.1% |
| Natives/Alaskans | 0.0 /100 | #326 | Tragic 14.2% |
| Potawatomi | 0.0 /100 | #327 | Tragic 14.2% |
| Chippewa | 0.0 /100 | #328 | Tragic 14.3% |
| Cajuns | 0.0 /100 | #329 | Tragic 14.4% |
| Navajo | 0.0 /100 | #330 | Tragic 14.4% |
| Tohono O'odham | 0.0 /100 | #331 | Tragic 14.6% |
| Seminole | 0.0 /100 | #332 | Tragic 14.7% |
| Yuman | 0.0 /100 | #333 | Tragic 14.7% |
| Cherokee | 0.0 /100 | #334 | Tragic 14.8% |
| Dutch West Indians | 0.0 /100 | #335 | Tragic 14.8% |
| Alaskan Athabascans | 0.0 /100 | #336 | Tragic 14.9% |
| Menominee | 0.0 /100 | #337 | Tragic 15.0% |
Demographics Similar to French Canadians by Male Disability
In terms of male disability, the demographic groups most similar to French Canadians are Spanish American (13.3%, a difference of 0.20%), Black/African American (13.2%, a difference of 0.41%), Arapaho (13.3%, a difference of 0.42%), French American Indian (13.4%, a difference of 0.58%), and Scotch-Irish (13.2%, a difference of 0.74%).
| Demographics | Rating | Rank | Male Disability |
| Pennsylvania Germans | 0.0 /100 | #298 | Tragic 13.0% |
| Celtics | 0.0 /100 | #299 | Tragic 13.0% |
| Cheyenne | 0.0 /100 | #300 | Tragic 13.0% |
| French | 0.0 /100 | #301 | Tragic 13.0% |
| Crow | 0.0 /100 | #302 | Tragic 13.1% |
| Scotch-Irish | 0.0 /100 | #303 | Tragic 13.2% |
| Blacks/African Americans | 0.0 /100 | #304 | Tragic 13.2% |
| French Canadians | 0.0 /100 | #305 | Tragic 13.3% |
| Spanish Americans | 0.0 /100 | #306 | Tragic 13.3% |
| Arapaho | 0.0 /100 | #307 | Tragic 13.3% |
| French American Indians | 0.0 /100 | #308 | Tragic 13.4% |
| Blackfeet | 0.0 /100 | #309 | Tragic 13.4% |
| Immigrants | Azores | 0.0 /100 | #310 | Tragic 13.4% |
| Delaware | 0.0 /100 | #311 | Tragic 13.5% |
| Yakama | 0.0 /100 | #312 | Tragic 13.5% |