Navajo vs Alsatian Male Disability
COMPARE
Navajo
Alsatian
Male Disability
Male Disability Comparison
Navajo
Alsatians
14.4%
MALE DISABILITY
0.0/ 100
METRIC RATING
330th/ 347
METRIC RANK
11.7%
MALE DISABILITY
3.3/ 100
METRIC RATING
222nd/ 347
METRIC RANK
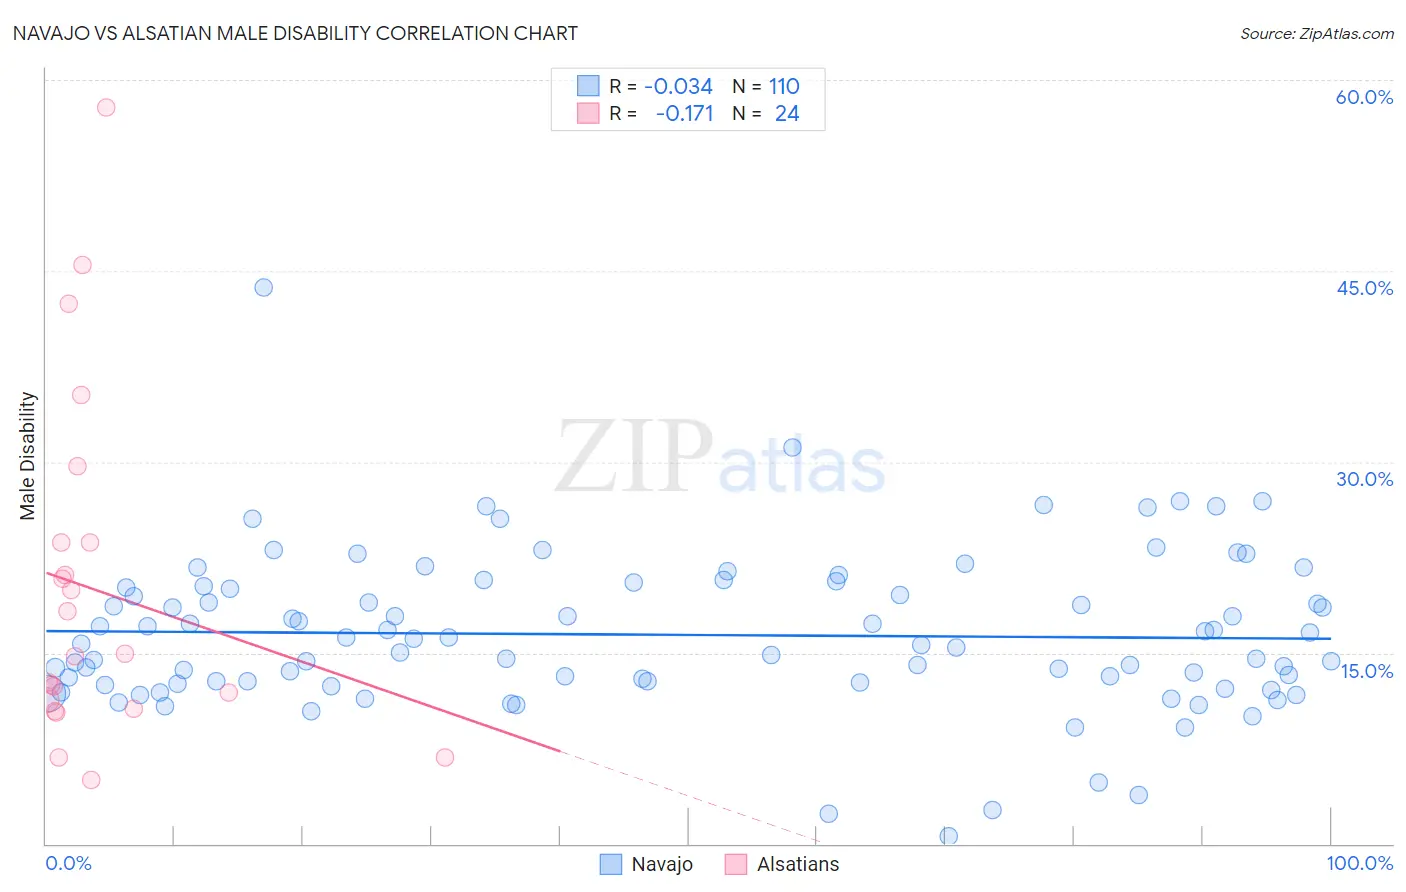
Navajo vs Alsatian Male Disability Correlation Chart
The statistical analysis conducted on geographies consisting of 224,784,363 people shows no correlation between the proportion of Navajo and percentage of males with a disability in the United States with a correlation coefficient (R) of -0.034 and weighted average of 14.4%. Similarly, the statistical analysis conducted on geographies consisting of 82,682,247 people shows a poor negative correlation between the proportion of Alsatians and percentage of males with a disability in the United States with a correlation coefficient (R) of -0.171 and weighted average of 11.7%, a difference of 22.6%.
Male Disability Correlation Summary
| Measurement | Navajo | Alsatian |
| Minimum | 0.60% | 5.0% |
| Maximum | 43.7% | 57.8% |
| Range | 43.1% | 52.8% |
| Mean | 16.4% | 19.9% |
| Median | 15.6% | 14.9% |
| Interquartile 25% (IQ1) | 12.7% | 10.9% |
| Interquartile 75% (IQ3) | 20.1% | 23.6% |
| Interquartile Range (IQR) | 7.5% | 12.7% |
| Standard Deviation (Sample) | 6.1% | 13.4% |
| Standard Deviation (Population) | 6.1% | 13.1% |
Similar Demographics by Male Disability
Demographics Similar to Navajo by Male Disability
In terms of male disability, the demographic groups most similar to Navajo are Cajun (14.4%, a difference of 0.23%), Chippewa (14.3%, a difference of 0.81%), Potawatomi (14.2%, a difference of 1.2%), Native/Alaskan (14.2%, a difference of 1.3%), and Tohono O'odham (14.6%, a difference of 1.5%).
| Demographics | Rating | Rank | Male Disability |
| Osage | 0.0 /100 | #323 | Tragic 14.0% |
| Comanche | 0.0 /100 | #324 | Tragic 14.1% |
| Ottawa | 0.0 /100 | #325 | Tragic 14.1% |
| Natives/Alaskans | 0.0 /100 | #326 | Tragic 14.2% |
| Potawatomi | 0.0 /100 | #327 | Tragic 14.2% |
| Chippewa | 0.0 /100 | #328 | Tragic 14.3% |
| Cajuns | 0.0 /100 | #329 | Tragic 14.4% |
| Navajo | 0.0 /100 | #330 | Tragic 14.4% |
| Tohono O'odham | 0.0 /100 | #331 | Tragic 14.6% |
| Seminole | 0.0 /100 | #332 | Tragic 14.7% |
| Yuman | 0.0 /100 | #333 | Tragic 14.7% |
| Cherokee | 0.0 /100 | #334 | Tragic 14.8% |
| Dutch West Indians | 0.0 /100 | #335 | Tragic 14.8% |
| Alaskan Athabascans | 0.0 /100 | #336 | Tragic 14.9% |
| Menominee | 0.0 /100 | #337 | Tragic 15.0% |
Demographics Similar to Alsatians by Male Disability
In terms of male disability, the demographic groups most similar to Alsatians are Immigrants from Bahamas (11.7%, a difference of 0.080%), Japanese (11.7%, a difference of 0.11%), Liberian (11.8%, a difference of 0.12%), Immigrants from Congo (11.7%, a difference of 0.15%), and Panamanian (11.7%, a difference of 0.17%).
| Demographics | Rating | Rank | Male Disability |
| Indonesians | 5.9 /100 | #215 | Tragic 11.6% |
| Immigrants | Dominican Republic | 4.9 /100 | #216 | Tragic 11.7% |
| Immigrants | Dominica | 4.6 /100 | #217 | Tragic 11.7% |
| Immigrants | England | 4.0 /100 | #218 | Tragic 11.7% |
| Panamanians | 3.8 /100 | #219 | Tragic 11.7% |
| Immigrants | Western Europe | 3.8 /100 | #220 | Tragic 11.7% |
| Immigrants | Congo | 3.7 /100 | #221 | Tragic 11.7% |
| Alsatians | 3.3 /100 | #222 | Tragic 11.7% |
| Immigrants | Bahamas | 3.2 /100 | #223 | Tragic 11.7% |
| Japanese | 3.1 /100 | #224 | Tragic 11.7% |
| Liberians | 3.1 /100 | #225 | Tragic 11.8% |
| Sub-Saharan Africans | 2.8 /100 | #226 | Tragic 11.8% |
| Austrians | 2.5 /100 | #227 | Tragic 11.8% |
| Hispanics or Latinos | 2.3 /100 | #228 | Tragic 11.8% |
| Bermudans | 2.3 /100 | #229 | Tragic 11.8% |