Tlingit-Haida vs Lithuanian Disability Age 18 to 34
COMPARE
Tlingit-Haida
Lithuanian
Disability Age 18 to 34
Disability Age 18 to 34 Comparison
Tlingit-Haida
Lithuanians
7.7%
DISABILITY AGE 18 TO 34
0.0/ 100
METRIC RATING
295th/ 347
METRIC RANK
7.0%
DISABILITY AGE 18 TO 34
4.1/ 100
METRIC RATING
229th/ 347
METRIC RANK
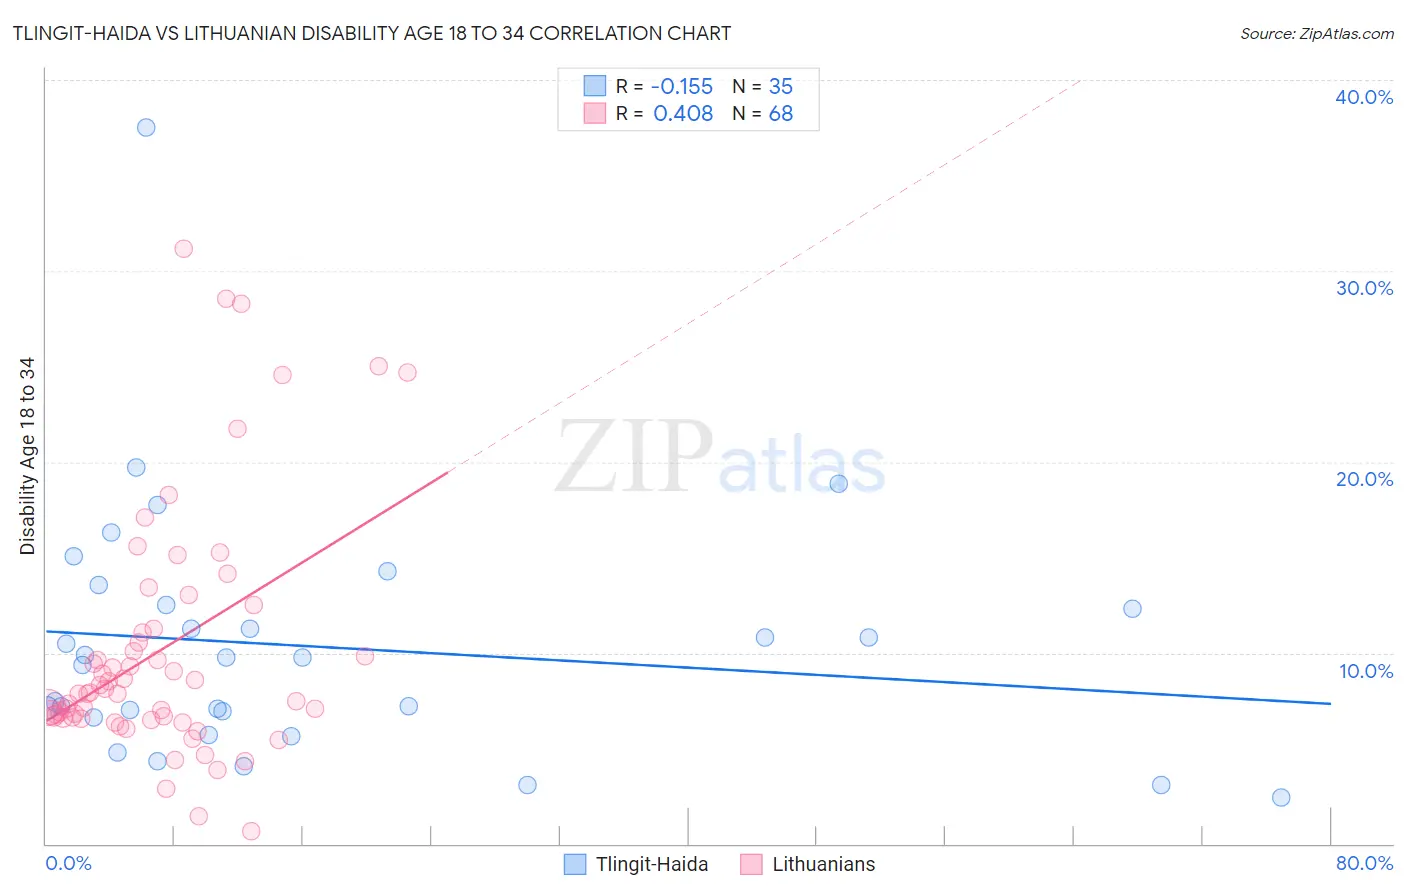
Tlingit-Haida vs Lithuanian Disability Age 18 to 34 Correlation Chart
The statistical analysis conducted on geographies consisting of 60,778,142 people shows a poor negative correlation between the proportion of Tlingit-Haida and percentage of population with a disability between the ages 18 and 35 in the United States with a correlation coefficient (R) of -0.155 and weighted average of 7.7%. Similarly, the statistical analysis conducted on geographies consisting of 420,363,620 people shows a moderate positive correlation between the proportion of Lithuanians and percentage of population with a disability between the ages 18 and 35 in the United States with a correlation coefficient (R) of 0.408 and weighted average of 7.0%, a difference of 10.5%.
Disability Age 18 to 34 Correlation Summary
| Measurement | Tlingit-Haida | Lithuanian |
| Minimum | 2.4% | 0.63% |
| Maximum | 37.5% | 31.1% |
| Range | 35.1% | 30.5% |
| Mean | 10.3% | 10.2% |
| Median | 9.7% | 7.9% |
| Interquartile 25% (IQ1) | 6.6% | 6.6% |
| Interquartile 75% (IQ3) | 12.5% | 11.2% |
| Interquartile Range (IQR) | 5.9% | 4.6% |
| Standard Deviation (Sample) | 6.5% | 6.5% |
| Standard Deviation (Population) | 6.4% | 6.4% |
Similar Demographics by Disability Age 18 to 34
Demographics Similar to Tlingit-Haida by Disability Age 18 to 34
In terms of disability age 18 to 34, the demographic groups most similar to Tlingit-Haida are Immigrants from Cabo Verde (7.7%, a difference of 0.010%), Scandinavian (7.7%, a difference of 0.16%), Cape Verdean (7.7%, a difference of 0.18%), Pueblo (7.7%, a difference of 0.19%), and Black/African American (7.7%, a difference of 0.22%).
| Demographics | Rating | Rank | Disability Age 18 to 34 |
| Whites/Caucasians | 0.0 /100 | #288 | Tragic 7.6% |
| Immigrants | Nonimmigrants | 0.0 /100 | #289 | Tragic 7.6% |
| Slovaks | 0.0 /100 | #290 | Tragic 7.7% |
| Irish | 0.0 /100 | #291 | Tragic 7.7% |
| Blacks/African Americans | 0.0 /100 | #292 | Tragic 7.7% |
| Scandinavians | 0.0 /100 | #293 | Tragic 7.7% |
| Immigrants | Cabo Verde | 0.0 /100 | #294 | Tragic 7.7% |
| Tlingit-Haida | 0.0 /100 | #295 | Tragic 7.7% |
| Cape Verdeans | 0.0 /100 | #296 | Tragic 7.7% |
| Pueblo | 0.0 /100 | #297 | Tragic 7.7% |
| Dutch | 0.0 /100 | #298 | Tragic 7.7% |
| Germans | 0.0 /100 | #299 | Tragic 7.7% |
| Scottish | 0.0 /100 | #300 | Tragic 7.7% |
| Pima | 0.0 /100 | #301 | Tragic 7.7% |
| Welsh | 0.0 /100 | #302 | Tragic 7.7% |
Demographics Similar to Lithuanians by Disability Age 18 to 34
In terms of disability age 18 to 34, the demographic groups most similar to Lithuanians are Immigrants from Yemen (7.0%, a difference of 0.030%), Immigrants from Canada (7.0%, a difference of 0.080%), Immigrants from North America (7.0%, a difference of 0.090%), Ute (7.0%, a difference of 0.11%), and Ugandan (6.9%, a difference of 0.13%).
| Demographics | Rating | Rank | Disability Age 18 to 34 |
| Immigrants | England | 5.3 /100 | #222 | Tragic 6.9% |
| Carpatho Rusyns | 5.2 /100 | #223 | Tragic 6.9% |
| Senegalese | 4.9 /100 | #224 | Tragic 6.9% |
| Central American Indians | 4.7 /100 | #225 | Tragic 6.9% |
| Ugandans | 4.4 /100 | #226 | Tragic 6.9% |
| Immigrants | Canada | 4.3 /100 | #227 | Tragic 7.0% |
| Immigrants | Yemen | 4.2 /100 | #228 | Tragic 7.0% |
| Lithuanians | 4.1 /100 | #229 | Tragic 7.0% |
| Immigrants | North America | 3.9 /100 | #230 | Tragic 7.0% |
| Ute | 3.8 /100 | #231 | Tragic 7.0% |
| Samoans | 3.2 /100 | #232 | Tragic 7.0% |
| New Zealanders | 2.7 /100 | #233 | Tragic 7.0% |
| Alsatians | 2.1 /100 | #234 | Tragic 7.0% |
| Sub-Saharan Africans | 1.7 /100 | #235 | Tragic 7.1% |
| Liberians | 1.5 /100 | #236 | Tragic 7.1% |