Immigrants from Moldova vs Liberian Disability Age 35 to 64
COMPARE
Immigrants from Moldova
Liberian
Disability Age 35 to 64
Disability Age 35 to 64 Comparison
Immigrants from Moldova
Liberians
10.6%
DISABILITY AGE 35 TO 64
95.5/ 100
METRIC RATING
118th/ 347
METRIC RANK
12.9%
DISABILITY AGE 35 TO 64
0.1/ 100
METRIC RATING
280th/ 347
METRIC RANK
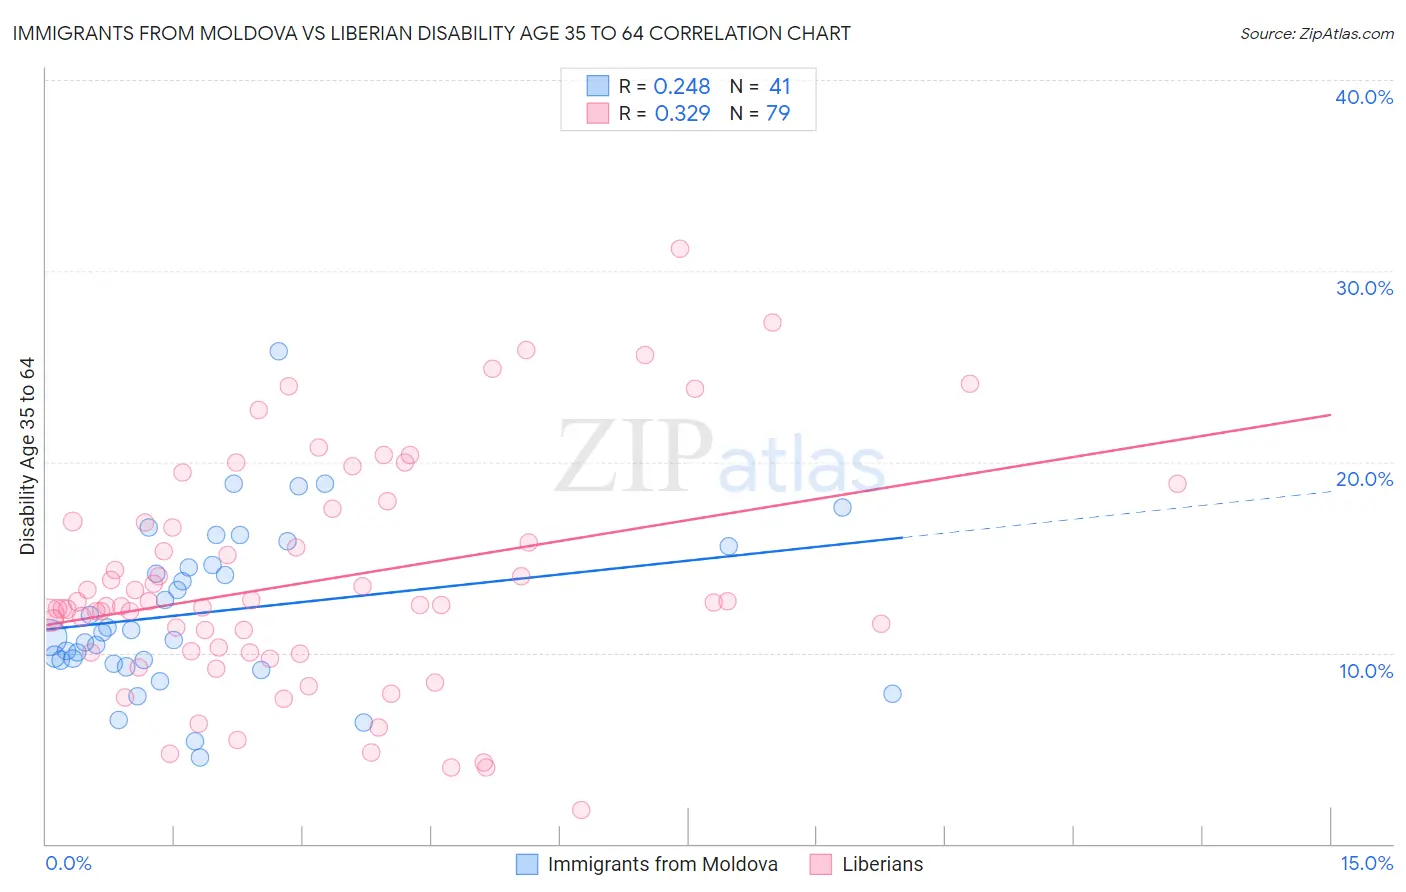
Immigrants from Moldova vs Liberian Disability Age 35 to 64 Correlation Chart
The statistical analysis conducted on geographies consisting of 124,364,571 people shows a weak positive correlation between the proportion of Immigrants from Moldova and percentage of population with a disability between the ages 34 and 64 in the United States with a correlation coefficient (R) of 0.248 and weighted average of 10.6%. Similarly, the statistical analysis conducted on geographies consisting of 118,034,378 people shows a mild positive correlation between the proportion of Liberians and percentage of population with a disability between the ages 34 and 64 in the United States with a correlation coefficient (R) of 0.329 and weighted average of 12.9%, a difference of 22.3%.
Disability Age 35 to 64 Correlation Summary
| Measurement | Immigrants from Moldova | Liberian |
| Minimum | 4.5% | 1.8% |
| Maximum | 25.8% | 31.1% |
| Range | 21.2% | 29.3% |
| Mean | 12.2% | 13.7% |
| Median | 11.1% | 12.5% |
| Interquartile 25% (IQ1) | 9.5% | 10.0% |
| Interquartile 75% (IQ3) | 15.1% | 16.9% |
| Interquartile Range (IQR) | 5.6% | 6.8% |
| Standard Deviation (Sample) | 4.3% | 6.0% |
| Standard Deviation (Population) | 4.3% | 5.9% |
Similar Demographics by Disability Age 35 to 64
Demographics Similar to Immigrants from Moldova by Disability Age 35 to 64
In terms of disability age 35 to 64, the demographic groups most similar to Immigrants from Moldova are Luxembourger (10.6%, a difference of 0.050%), Vietnamese (10.6%, a difference of 0.070%), Immigrants from South Eastern Asia (10.6%, a difference of 0.090%), Immigrants from Nepal (10.6%, a difference of 0.19%), and Romanian (10.6%, a difference of 0.24%).
| Demographics | Rating | Rank | Disability Age 35 to 64 |
| Brazilians | 96.9 /100 | #111 | Exceptional 10.5% |
| Assyrians/Chaldeans/Syriacs | 96.8 /100 | #112 | Exceptional 10.5% |
| Tongans | 96.6 /100 | #113 | Exceptional 10.5% |
| Immigrants | Morocco | 96.6 /100 | #114 | Exceptional 10.5% |
| Immigrants | Netherlands | 96.3 /100 | #115 | Exceptional 10.5% |
| Immigrants | Nepal | 95.9 /100 | #116 | Exceptional 10.6% |
| Immigrants | South Eastern Asia | 95.7 /100 | #117 | Exceptional 10.6% |
| Immigrants | Moldova | 95.5 /100 | #118 | Exceptional 10.6% |
| Luxembourgers | 95.5 /100 | #119 | Exceptional 10.6% |
| Vietnamese | 95.4 /100 | #120 | Exceptional 10.6% |
| Romanians | 95.0 /100 | #121 | Exceptional 10.6% |
| Immigrants | Norway | 95.0 /100 | #122 | Exceptional 10.6% |
| Maltese | 94.8 /100 | #123 | Exceptional 10.6% |
| Estonians | 94.5 /100 | #124 | Exceptional 10.6% |
| Albanians | 94.2 /100 | #125 | Exceptional 10.6% |
Demographics Similar to Liberians by Disability Age 35 to 64
In terms of disability age 35 to 64, the demographic groups most similar to Liberians are Immigrants from Micronesia (12.9%, a difference of 0.17%), French Canadian (12.9%, a difference of 0.19%), Scotch-Irish (13.0%, a difference of 0.20%), Immigrants from Dominican Republic (12.9%, a difference of 0.22%), and Immigrants from Laos (13.0%, a difference of 0.29%).
| Demographics | Rating | Rank | Disability Age 35 to 64 |
| Pennsylvania Germans | 0.1 /100 | #273 | Tragic 12.8% |
| Celtics | 0.1 /100 | #274 | Tragic 12.9% |
| Dominicans | 0.1 /100 | #275 | Tragic 12.9% |
| Somalis | 0.1 /100 | #276 | Tragic 12.9% |
| Immigrants | Dominican Republic | 0.1 /100 | #277 | Tragic 12.9% |
| French Canadians | 0.1 /100 | #278 | Tragic 12.9% |
| Immigrants | Micronesia | 0.1 /100 | #279 | Tragic 12.9% |
| Liberians | 0.1 /100 | #280 | Tragic 12.9% |
| Scotch-Irish | 0.1 /100 | #281 | Tragic 13.0% |
| Immigrants | Laos | 0.1 /100 | #282 | Tragic 13.0% |
| Central American Indians | 0.0 /100 | #283 | Tragic 13.0% |
| Immigrants | Nonimmigrants | 0.0 /100 | #284 | Tragic 13.0% |
| Immigrants | Somalia | 0.0 /100 | #285 | Tragic 13.1% |
| Hmong | 0.0 /100 | #286 | Tragic 13.1% |
| Tlingit-Haida | 0.0 /100 | #287 | Tragic 13.2% |