Lumbee vs Immigrants from Zimbabwe Disability Age Over 75
COMPARE
Lumbee
Immigrants from Zimbabwe
Disability Age Over 75
Disability Age Over 75 Comparison
Lumbee
Immigrants from Zimbabwe
56.2%
DISABILITY AGE OVER 75
0.0/ 100
METRIC RATING
342nd/ 347
METRIC RANK
47.2%
DISABILITY AGE OVER 75
64.4/ 100
METRIC RATING
165th/ 347
METRIC RANK
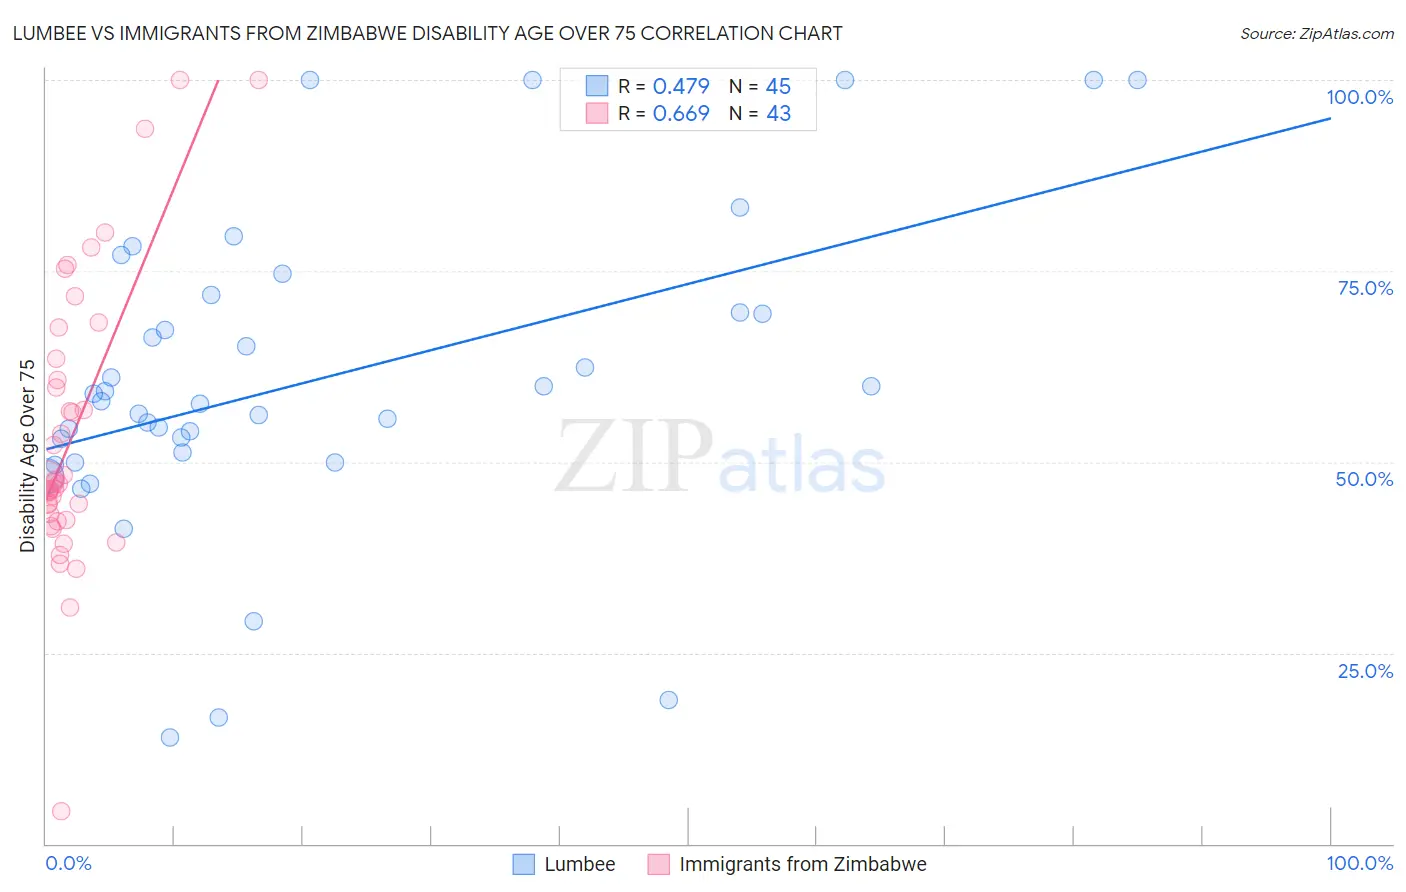
Lumbee vs Immigrants from Zimbabwe Disability Age Over 75 Correlation Chart
The statistical analysis conducted on geographies consisting of 92,131,949 people shows a moderate positive correlation between the proportion of Lumbee and percentage of population with a disability over the age of 75 in the United States with a correlation coefficient (R) of 0.479 and weighted average of 56.2%. Similarly, the statistical analysis conducted on geographies consisting of 117,713,093 people shows a significant positive correlation between the proportion of Immigrants from Zimbabwe and percentage of population with a disability over the age of 75 in the United States with a correlation coefficient (R) of 0.669 and weighted average of 47.2%, a difference of 19.2%.
Disability Age Over 75 Correlation Summary
| Measurement | Lumbee | Immigrants from Zimbabwe |
| Minimum | 13.8% | 4.3% |
| Maximum | 100.0% | 100.0% |
| Range | 86.2% | 95.7% |
| Mean | 60.7% | 53.7% |
| Median | 58.0% | 47.3% |
| Interquartile 25% (IQ1) | 50.6% | 42.4% |
| Interquartile 75% (IQ3) | 70.7% | 63.4% |
| Interquartile Range (IQR) | 20.1% | 21.0% |
| Standard Deviation (Sample) | 20.4% | 18.7% |
| Standard Deviation (Population) | 20.2% | 18.5% |
Similar Demographics by Disability Age Over 75
Demographics Similar to Lumbee by Disability Age Over 75
In terms of disability age over 75, the demographic groups most similar to Lumbee are Houma (56.2%, a difference of 0.16%), Pueblo (55.9%, a difference of 0.67%), Pima (55.8%, a difference of 0.76%), Tohono O'odham (56.7%, a difference of 0.83%), and Colville (55.4%, a difference of 1.6%).
| Demographics | Rating | Rank | Disability Age Over 75 |
| Apache | 0.0 /100 | #333 | Tragic 53.6% |
| Alaskan Athabascans | 0.0 /100 | #334 | Tragic 54.0% |
| Kiowa | 0.0 /100 | #335 | Tragic 54.2% |
| Immigrants | Armenia | 0.0 /100 | #336 | Tragic 54.3% |
| Yuman | 0.0 /100 | #337 | Tragic 54.4% |
| Colville | 0.0 /100 | #338 | Tragic 55.4% |
| Pima | 0.0 /100 | #339 | Tragic 55.8% |
| Pueblo | 0.0 /100 | #340 | Tragic 55.9% |
| Houma | 0.0 /100 | #341 | Tragic 56.2% |
| Lumbee | 0.0 /100 | #342 | Tragic 56.2% |
| Tohono O'odham | 0.0 /100 | #343 | Tragic 56.7% |
| Navajo | 0.0 /100 | #344 | Tragic 58.3% |
| Inupiat | 0.0 /100 | #345 | Tragic 58.4% |
| Tsimshian | 0.0 /100 | #346 | Tragic 59.2% |
| Yup'ik | 0.0 /100 | #347 | Tragic 61.1% |
Demographics Similar to Immigrants from Zimbabwe by Disability Age Over 75
In terms of disability age over 75, the demographic groups most similar to Immigrants from Zimbabwe are French (47.2%, a difference of 0.0%), Immigrants from Sierra Leone (47.2%, a difference of 0.0%), Immigrants from Eastern Africa (47.2%, a difference of 0.030%), Pennsylvania German (47.2%, a difference of 0.040%), and Moroccan (47.2%, a difference of 0.040%).
| Demographics | Rating | Rank | Disability Age Over 75 |
| Immigrants | Guyana | 71.9 /100 | #158 | Good 47.1% |
| Immigrants | Morocco | 71.4 /100 | #159 | Good 47.1% |
| Immigrants | Middle Africa | 68.3 /100 | #160 | Good 47.1% |
| South American Indians | 68.1 /100 | #161 | Good 47.1% |
| Pennsylvania Germans | 66.0 /100 | #162 | Good 47.2% |
| Immigrants | Eastern Africa | 65.5 /100 | #163 | Good 47.2% |
| French | 64.6 /100 | #164 | Good 47.2% |
| Immigrants | Zimbabwe | 64.4 /100 | #165 | Good 47.2% |
| Immigrants | Sierra Leone | 64.4 /100 | #166 | Good 47.2% |
| Moroccans | 62.9 /100 | #167 | Good 47.2% |
| Kenyans | 58.8 /100 | #168 | Average 47.2% |
| Celtics | 58.7 /100 | #169 | Average 47.2% |
| German Russians | 56.2 /100 | #170 | Average 47.3% |
| Immigrants | Africa | 53.6 /100 | #171 | Average 47.3% |
| Scotch-Irish | 52.5 /100 | #172 | Average 47.3% |