Native/Alaskan vs Immigrants from Canada Cognitive Disability
COMPARE
Native/Alaskan
Immigrants from Canada
Cognitive Disability
Cognitive Disability Comparison
Natives/Alaskans
Immigrants from Canada
18.1%
COGNITIVE DISABILITY
0.1/ 100
METRIC RATING
289th/ 347
METRIC RANK
16.5%
COGNITIVE DISABILITY
99.8/ 100
METRIC RATING
43rd/ 347
METRIC RANK
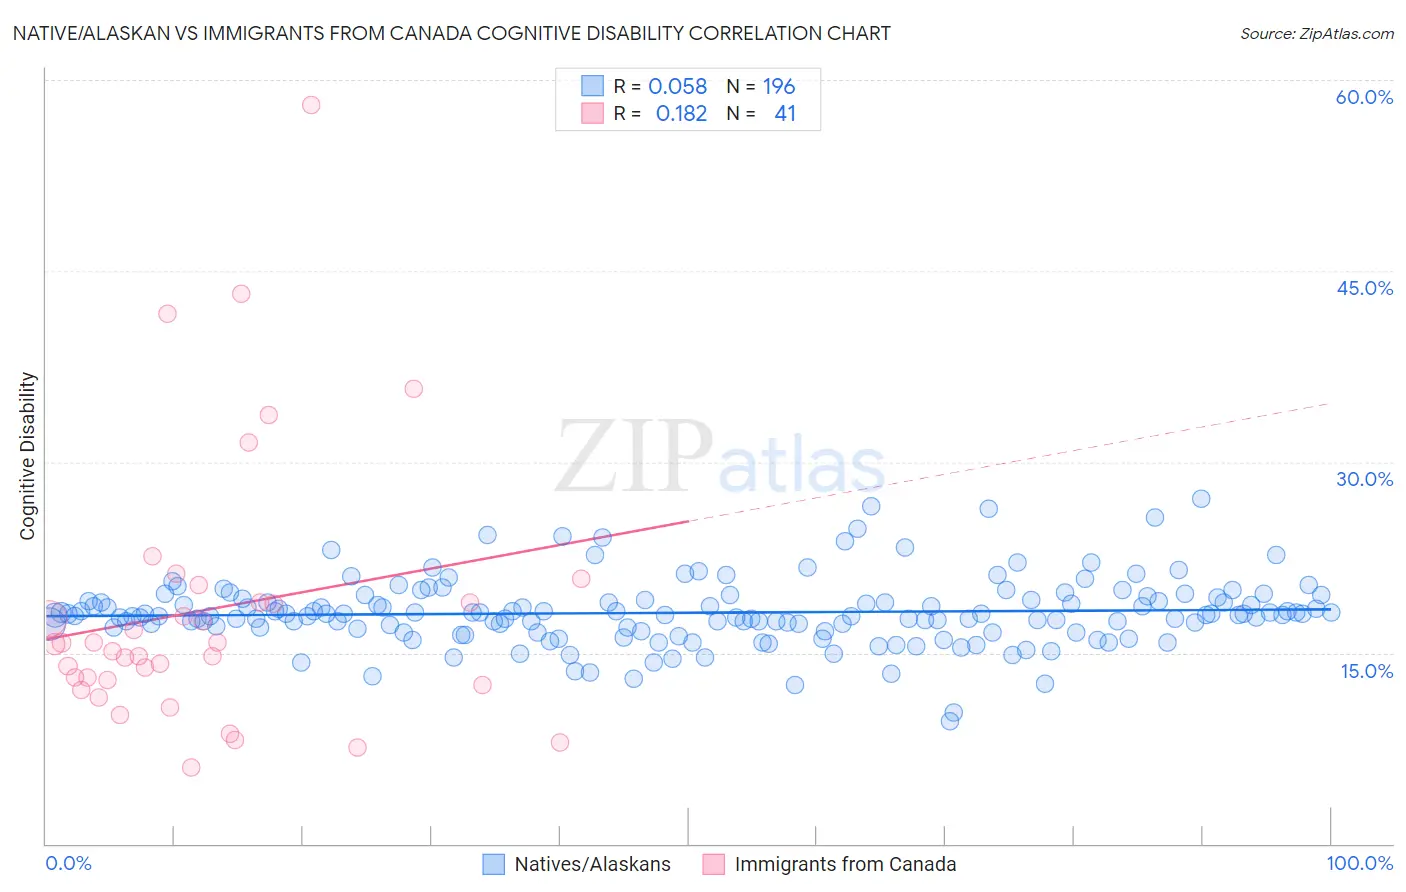
Native/Alaskan vs Immigrants from Canada Cognitive Disability Correlation Chart
The statistical analysis conducted on geographies consisting of 512,906,873 people shows a slight positive correlation between the proportion of Natives/Alaskans and percentage of population with cognitive disability in the United States with a correlation coefficient (R) of 0.058 and weighted average of 18.1%. Similarly, the statistical analysis conducted on geographies consisting of 459,370,833 people shows a poor positive correlation between the proportion of Immigrants from Canada and percentage of population with cognitive disability in the United States with a correlation coefficient (R) of 0.182 and weighted average of 16.5%, a difference of 10.1%.
Cognitive Disability Correlation Summary
| Measurement | Native/Alaskan | Immigrants from Canada |
| Minimum | 9.6% | 6.0% |
| Maximum | 27.1% | 58.1% |
| Range | 17.4% | 52.1% |
| Mean | 18.1% | 18.4% |
| Median | 18.0% | 15.7% |
| Interquartile 25% (IQ1) | 16.9% | 12.7% |
| Interquartile 75% (IQ3) | 19.2% | 19.7% |
| Interquartile Range (IQR) | 2.2% | 7.0% |
| Standard Deviation (Sample) | 2.6% | 10.6% |
| Standard Deviation (Population) | 2.6% | 10.5% |
Similar Demographics by Cognitive Disability
Demographics Similar to Natives/Alaskans by Cognitive Disability
In terms of cognitive disability, the demographic groups most similar to Natives/Alaskans are Immigrants from West Indies (18.1%, a difference of 0.010%), Dutch West Indian (18.1%, a difference of 0.020%), Immigrants from Africa (18.1%, a difference of 0.030%), Kenyan (18.1%, a difference of 0.060%), and Bermudan (18.1%, a difference of 0.10%).
| Demographics | Rating | Rank | Cognitive Disability |
| Immigrants | Cambodia | 0.1 /100 | #282 | Tragic 18.1% |
| Nigerians | 0.1 /100 | #283 | Tragic 18.1% |
| Immigrants | Uganda | 0.1 /100 | #284 | Tragic 18.1% |
| Bermudans | 0.1 /100 | #285 | Tragic 18.1% |
| Kenyans | 0.1 /100 | #286 | Tragic 18.1% |
| Dutch West Indians | 0.1 /100 | #287 | Tragic 18.1% |
| Immigrants | West Indies | 0.1 /100 | #288 | Tragic 18.1% |
| Natives/Alaskans | 0.1 /100 | #289 | Tragic 18.1% |
| Immigrants | Africa | 0.1 /100 | #290 | Tragic 18.1% |
| Ottawa | 0.1 /100 | #291 | Tragic 18.2% |
| Iroquois | 0.1 /100 | #292 | Tragic 18.2% |
| Central American Indians | 0.1 /100 | #293 | Tragic 18.2% |
| British West Indians | 0.1 /100 | #294 | Tragic 18.2% |
| German Russians | 0.0 /100 | #295 | Tragic 18.2% |
| Immigrants | Burma/Myanmar | 0.0 /100 | #296 | Tragic 18.2% |
Demographics Similar to Immigrants from Canada by Cognitive Disability
In terms of cognitive disability, the demographic groups most similar to Immigrants from Canada are Macedonian (16.5%, a difference of 0.030%), Immigrants from Europe (16.5%, a difference of 0.030%), Immigrants from Colombia (16.5%, a difference of 0.050%), Hungarian (16.5%, a difference of 0.060%), and Immigrants from Italy (16.5%, a difference of 0.070%).
| Demographics | Rating | Rank | Cognitive Disability |
| Greeks | 99.9 /100 | #36 | Exceptional 16.4% |
| Slovenes | 99.9 /100 | #37 | Exceptional 16.5% |
| Immigrants | Eastern Europe | 99.9 /100 | #38 | Exceptional 16.5% |
| Bolivians | 99.9 /100 | #39 | Exceptional 16.5% |
| Immigrants | Belarus | 99.9 /100 | #40 | Exceptional 16.5% |
| Cubans | 99.9 /100 | #41 | Exceptional 16.5% |
| Hungarians | 99.9 /100 | #42 | Exceptional 16.5% |
| Immigrants | Canada | 99.8 /100 | #43 | Exceptional 16.5% |
| Macedonians | 99.8 /100 | #44 | Exceptional 16.5% |
| Immigrants | Europe | 99.8 /100 | #45 | Exceptional 16.5% |
| Immigrants | Colombia | 99.8 /100 | #46 | Exceptional 16.5% |
| Immigrants | Italy | 99.8 /100 | #47 | Exceptional 16.5% |
| Immigrants | North America | 99.8 /100 | #48 | Exceptional 16.5% |
| Iranians | 99.8 /100 | #49 | Exceptional 16.5% |
| Norwegians | 99.8 /100 | #50 | Exceptional 16.5% |