Albanian vs Immigrants from Canada Disability Age Over 75
COMPARE
Albanian
Immigrants from Canada
Disability Age Over 75
Disability Age Over 75 Comparison
Albanians
Immigrants from Canada
46.3%
DISABILITY AGE OVER 75
98.1/ 100
METRIC RATING
94th/ 347
METRIC RANK
45.7%
DISABILITY AGE OVER 75
99.8/ 100
METRIC RATING
47th/ 347
METRIC RANK
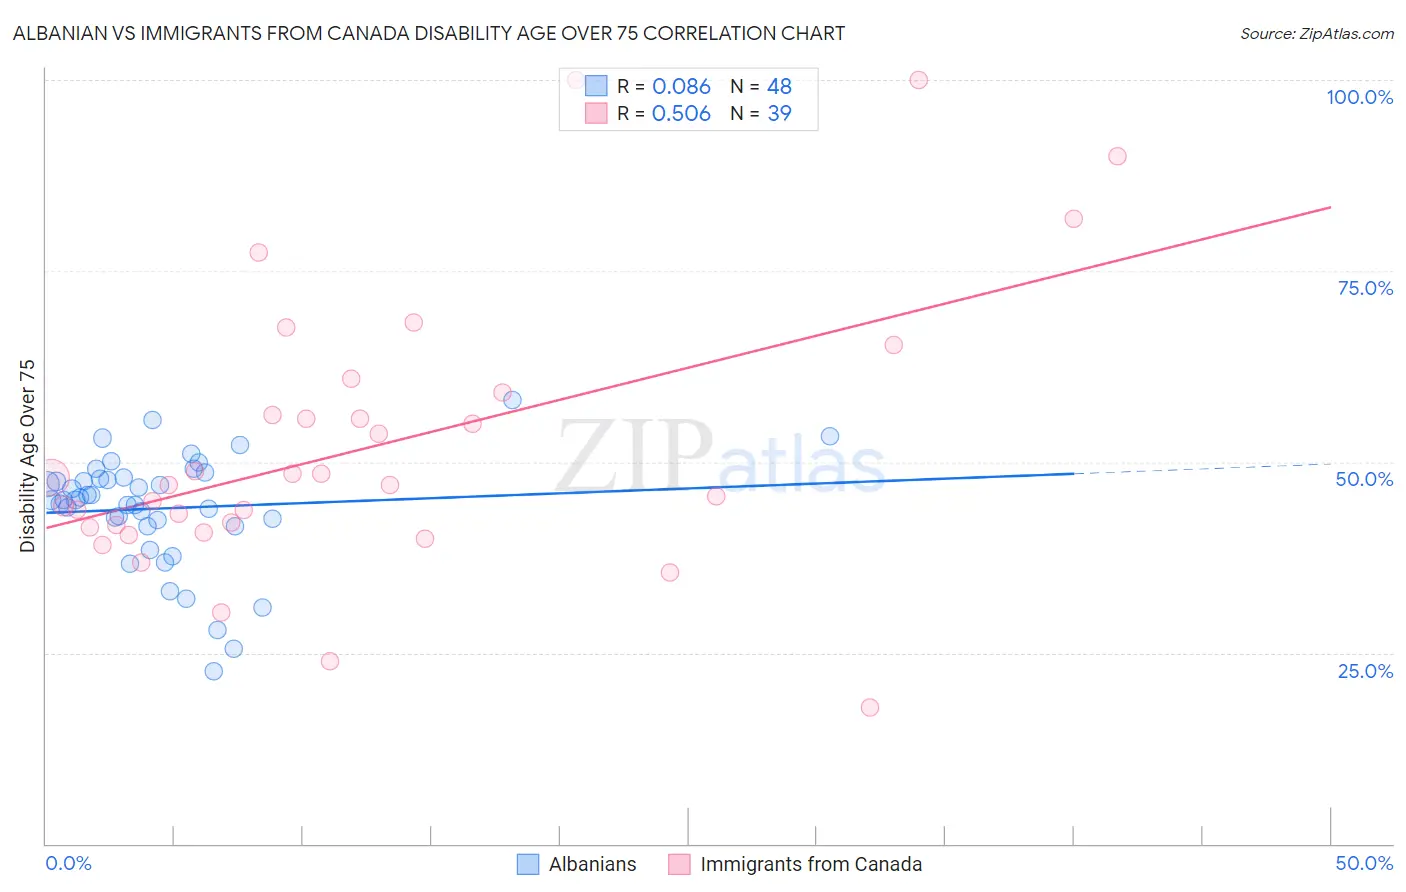
Albanian vs Immigrants from Canada Disability Age Over 75 Correlation Chart
The statistical analysis conducted on geographies consisting of 193,034,133 people shows a slight positive correlation between the proportion of Albanians and percentage of population with a disability over the age of 75 in the United States with a correlation coefficient (R) of 0.086 and weighted average of 46.3%. Similarly, the statistical analysis conducted on geographies consisting of 458,640,935 people shows a substantial positive correlation between the proportion of Immigrants from Canada and percentage of population with a disability over the age of 75 in the United States with a correlation coefficient (R) of 0.506 and weighted average of 45.7%, a difference of 1.3%.
Disability Age Over 75 Correlation Summary
| Measurement | Albanian | Immigrants from Canada |
| Minimum | 22.6% | 17.9% |
| Maximum | 58.2% | 100.0% |
| Range | 35.6% | 82.1% |
| Mean | 43.9% | 52.0% |
| Median | 45.0% | 47.0% |
| Interquartile 25% (IQ1) | 42.0% | 41.4% |
| Interquartile 75% (IQ3) | 47.9% | 59.1% |
| Interquartile Range (IQR) | 5.9% | 17.7% |
| Standard Deviation (Sample) | 7.4% | 18.3% |
| Standard Deviation (Population) | 7.3% | 18.1% |
Similar Demographics by Disability Age Over 75
Demographics Similar to Albanians by Disability Age Over 75
In terms of disability age over 75, the demographic groups most similar to Albanians are Ugandan (46.3%, a difference of 0.030%), Immigrants from Brazil (46.3%, a difference of 0.030%), Immigrants from China (46.3%, a difference of 0.030%), German (46.3%, a difference of 0.040%), and Finnish (46.3%, a difference of 0.050%).
| Demographics | Rating | Rank | Disability Age Over 75 |
| Danes | 98.6 /100 | #87 | Exceptional 46.2% |
| Uruguayans | 98.4 /100 | #88 | Exceptional 46.2% |
| Immigrants | Saudi Arabia | 98.4 /100 | #89 | Exceptional 46.3% |
| Northern Europeans | 98.3 /100 | #90 | Exceptional 46.3% |
| Immigrants | Egypt | 98.3 /100 | #91 | Exceptional 46.3% |
| Germans | 98.2 /100 | #92 | Exceptional 46.3% |
| Ugandans | 98.2 /100 | #93 | Exceptional 46.3% |
| Albanians | 98.1 /100 | #94 | Exceptional 46.3% |
| Immigrants | Brazil | 98.0 /100 | #95 | Exceptional 46.3% |
| Immigrants | China | 98.0 /100 | #96 | Exceptional 46.3% |
| Finns | 97.9 /100 | #97 | Exceptional 46.3% |
| Immigrants | Japan | 97.8 /100 | #98 | Exceptional 46.3% |
| Palestinians | 97.7 /100 | #99 | Exceptional 46.3% |
| Immigrants | Eastern Europe | 97.7 /100 | #100 | Exceptional 46.3% |
| Mongolians | 97.7 /100 | #101 | Exceptional 46.3% |
Demographics Similar to Immigrants from Canada by Disability Age Over 75
In terms of disability age over 75, the demographic groups most similar to Immigrants from Canada are Croatian (45.7%, a difference of 0.010%), Swedish (45.7%, a difference of 0.020%), Australian (45.7%, a difference of 0.040%), Turkish (45.7%, a difference of 0.040%), and Immigrants from North America (45.7%, a difference of 0.070%).
| Demographics | Rating | Rank | Disability Age Over 75 |
| Slovenes | 99.9 /100 | #40 | Exceptional 45.6% |
| Immigrants | Singapore | 99.8 /100 | #41 | Exceptional 45.6% |
| Greeks | 99.8 /100 | #42 | Exceptional 45.6% |
| Czechs | 99.8 /100 | #43 | Exceptional 45.7% |
| Australians | 99.8 /100 | #44 | Exceptional 45.7% |
| Turks | 99.8 /100 | #45 | Exceptional 45.7% |
| Swedes | 99.8 /100 | #46 | Exceptional 45.7% |
| Immigrants | Canada | 99.8 /100 | #47 | Exceptional 45.7% |
| Croatians | 99.8 /100 | #48 | Exceptional 45.7% |
| Immigrants | North America | 99.8 /100 | #49 | Exceptional 45.7% |
| Belgians | 99.7 /100 | #50 | Exceptional 45.8% |
| Immigrants | Korea | 99.7 /100 | #51 | Exceptional 45.8% |
| Immigrants | France | 99.7 /100 | #52 | Exceptional 45.8% |
| Immigrants | Italy | 99.7 /100 | #53 | Exceptional 45.8% |
| Slovaks | 99.6 /100 | #54 | Exceptional 45.8% |