Native/Alaskan vs Immigrants from Canada Average Family Size
COMPARE
Native/Alaskan
Immigrants from Canada
Average Family Size
Average Family Size Comparison
Natives/Alaskans
Immigrants from Canada
3.45
AVERAGE FAMILY SIZE
100.0/ 100
METRIC RATING
24th/ 347
METRIC RANK
3.12
AVERAGE FAMILY SIZE
0.0/ 100
METRIC RATING
322nd/ 347
METRIC RANK
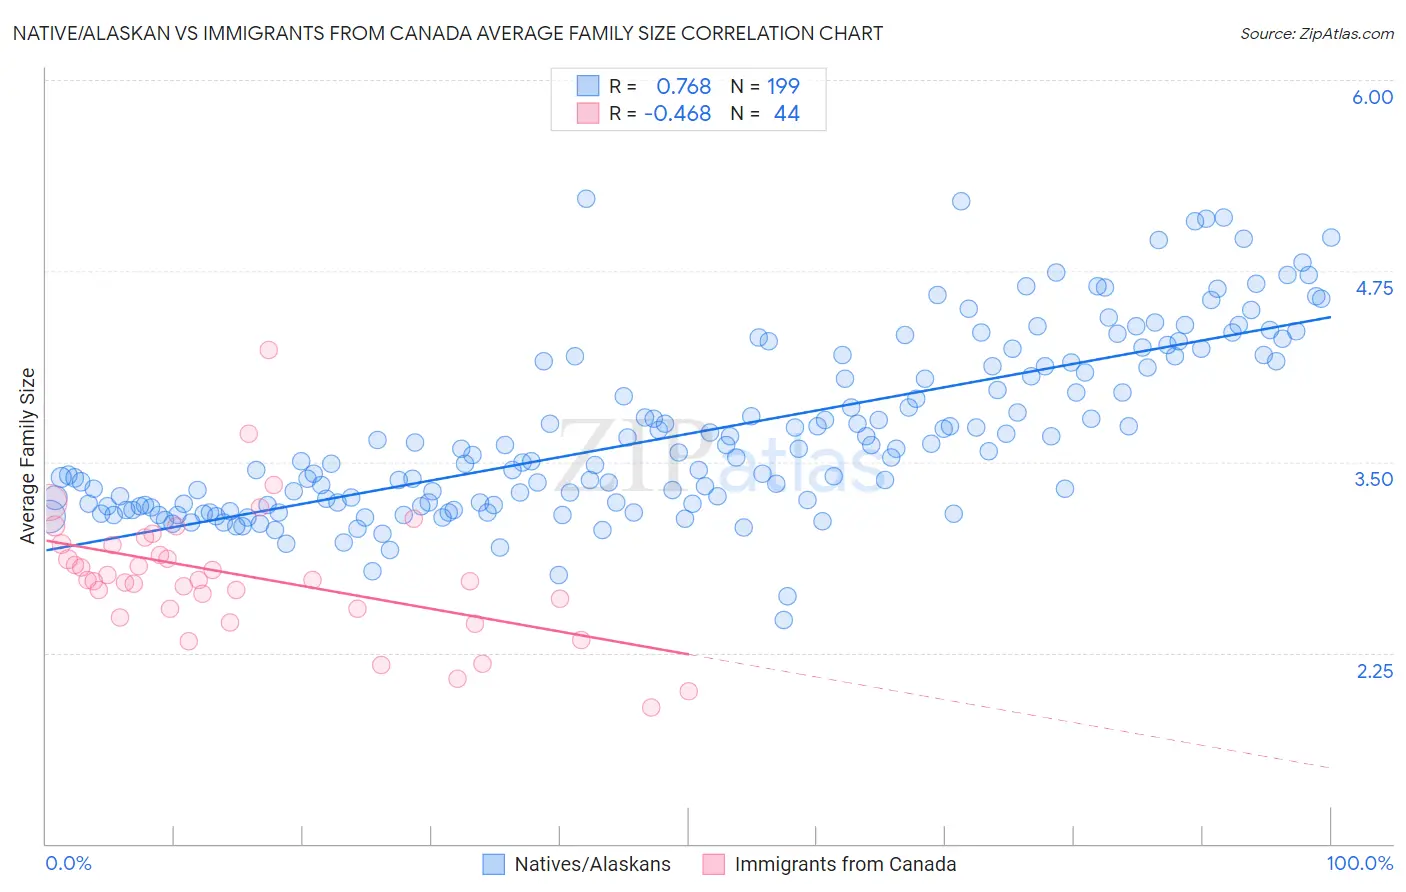
Native/Alaskan vs Immigrants from Canada Average Family Size Correlation Chart
The statistical analysis conducted on geographies consisting of 512,654,103 people shows a strong positive correlation between the proportion of Natives/Alaskans and average family size in the United States with a correlation coefficient (R) of 0.768 and weighted average of 3.45. Similarly, the statistical analysis conducted on geographies consisting of 459,128,299 people shows a moderate negative correlation between the proportion of Immigrants from Canada and average family size in the United States with a correlation coefficient (R) of -0.468 and weighted average of 3.12, a difference of 10.7%.
Average Family Size Correlation Summary
| Measurement | Native/Alaskan | Immigrants from Canada |
| Minimum | 2.46 | 1.89 |
| Maximum | 5.22 | 4.23 |
| Range | 2.76 | 2.34 |
| Mean | 3.68 | 2.76 |
| Median | 3.53 | 2.72 |
| Interquartile 25% (IQ1) | 3.22 | 2.54 |
| Interquartile 75% (IQ3) | 4.15 | 2.96 |
| Interquartile Range (IQR) | 0.93 | 0.42 |
| Standard Deviation (Sample) | 0.58 | 0.42 |
| Standard Deviation (Population) | 0.58 | 0.42 |
Similar Demographics by Average Family Size
Demographics Similar to Natives/Alaskans by Average Family Size
In terms of average family size, the demographic groups most similar to Natives/Alaskans are Yakama (3.45, a difference of 0.11%), Immigrants from Fiji (3.45, a difference of 0.12%), Apache (3.46, a difference of 0.41%), Yuman (3.47, a difference of 0.47%), and Native Hawaiian (3.43, a difference of 0.62%).
| Demographics | Rating | Rank | Average Family Size |
| Immigrants | El Salvador | 100.0 /100 | #17 | Exceptional 3.49 |
| Salvadorans | 100.0 /100 | #18 | Exceptional 3.48 |
| Mexicans | 100.0 /100 | #19 | Exceptional 3.48 |
| Cheyenne | 100.0 /100 | #20 | Exceptional 3.47 |
| Yuman | 100.0 /100 | #21 | Exceptional 3.47 |
| Apache | 100.0 /100 | #22 | Exceptional 3.46 |
| Immigrants | Fiji | 100.0 /100 | #23 | Exceptional 3.45 |
| Natives/Alaskans | 100.0 /100 | #24 | Exceptional 3.45 |
| Yakama | 100.0 /100 | #25 | Exceptional 3.45 |
| Native Hawaiians | 100.0 /100 | #26 | Exceptional 3.43 |
| Mexican American Indians | 100.0 /100 | #27 | Exceptional 3.43 |
| Immigrants | Latin America | 100.0 /100 | #28 | Exceptional 3.42 |
| Nepalese | 100.0 /100 | #29 | Exceptional 3.42 |
| Samoans | 100.0 /100 | #30 | Exceptional 3.42 |
| Central Americans | 100.0 /100 | #31 | Exceptional 3.41 |
Demographics Similar to Immigrants from Canada by Average Family Size
In terms of average family size, the demographic groups most similar to Immigrants from Canada are Immigrants from Austria (3.12, a difference of 0.0%), Immigrants from North America (3.12, a difference of 0.030%), Soviet Union (3.11, a difference of 0.030%), Eastern European (3.12, a difference of 0.11%), and Welsh (3.12, a difference of 0.11%).
| Demographics | Rating | Rank | Average Family Size |
| Immigrants | Scotland | 0.1 /100 | #315 | Tragic 3.12 |
| Serbians | 0.1 /100 | #316 | Tragic 3.12 |
| Italians | 0.1 /100 | #317 | Tragic 3.12 |
| Eastern Europeans | 0.1 /100 | #318 | Tragic 3.12 |
| Welsh | 0.1 /100 | #319 | Tragic 3.12 |
| Immigrants | North America | 0.0 /100 | #320 | Tragic 3.12 |
| Immigrants | Austria | 0.0 /100 | #321 | Tragic 3.12 |
| Immigrants | Canada | 0.0 /100 | #322 | Tragic 3.12 |
| Soviet Union | 0.0 /100 | #323 | Tragic 3.11 |
| Celtics | 0.0 /100 | #324 | Tragic 3.11 |
| English | 0.0 /100 | #325 | Tragic 3.11 |
| Ottawa | 0.0 /100 | #326 | Tragic 3.11 |
| Dutch | 0.0 /100 | #327 | Tragic 3.11 |
| Czechs | 0.0 /100 | #328 | Tragic 3.11 |
| Belgians | 0.0 /100 | #329 | Tragic 3.11 |