Native/Alaskan vs Hungarian Median Female Earnings
COMPARE
Native/Alaskan
Hungarian
Median Female Earnings
Median Female Earnings Comparison
Natives/Alaskans
Hungarians
$33,806
MEDIAN FEMALE EARNINGS
0.0/ 100
METRIC RATING
331st/ 347
METRIC RANK
$39,510
MEDIAN FEMALE EARNINGS
40.3/ 100
METRIC RATING
183rd/ 347
METRIC RANK
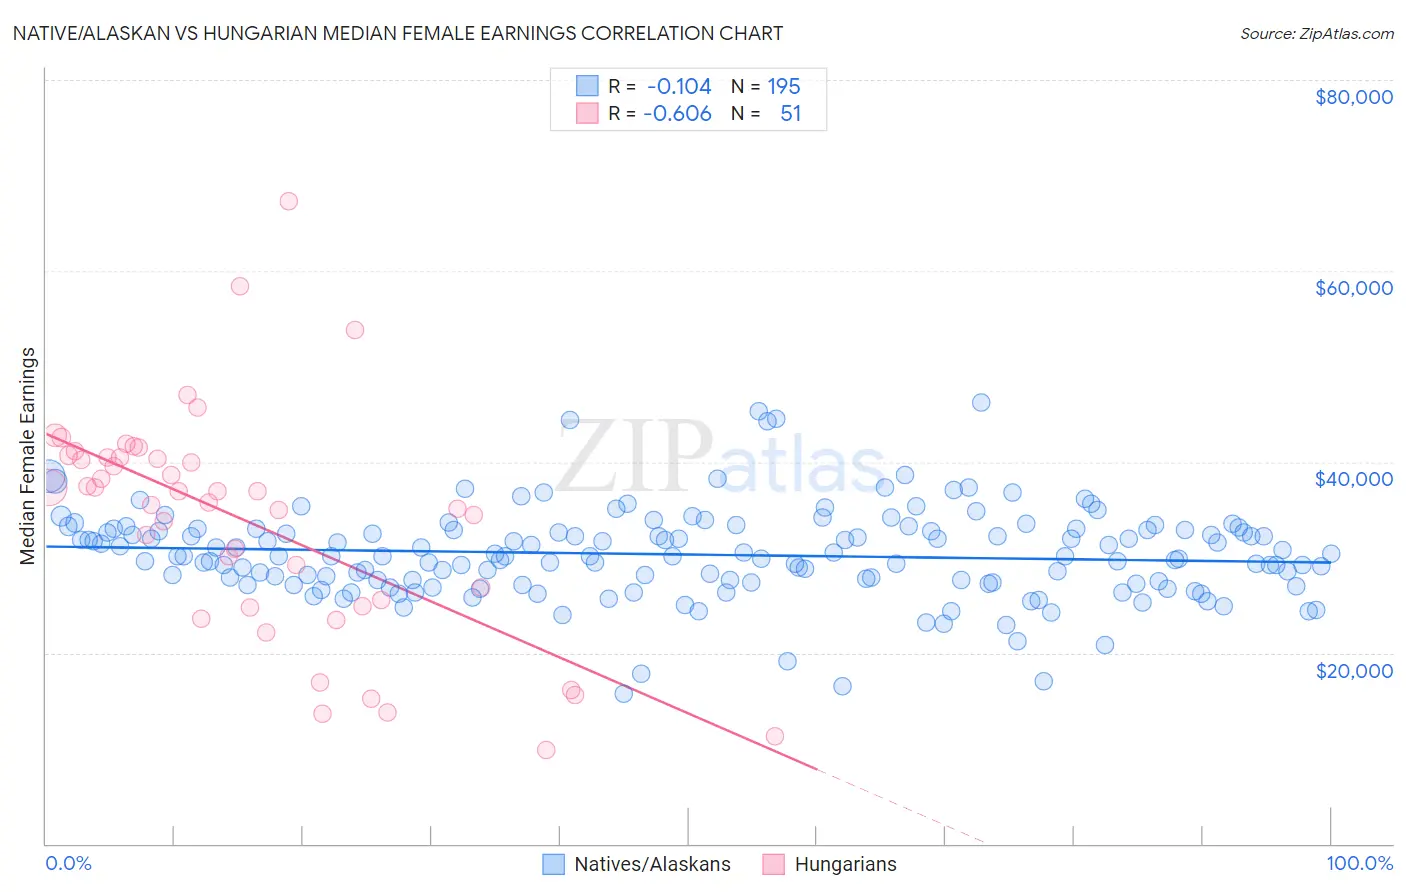
Native/Alaskan vs Hungarian Median Female Earnings Correlation Chart
The statistical analysis conducted on geographies consisting of 512,112,793 people shows a poor negative correlation between the proportion of Natives/Alaskans and median female earnings in the United States with a correlation coefficient (R) of -0.104 and weighted average of $33,806. Similarly, the statistical analysis conducted on geographies consisting of 485,733,652 people shows a significant negative correlation between the proportion of Hungarians and median female earnings in the United States with a correlation coefficient (R) of -0.606 and weighted average of $39,510, a difference of 16.9%.
Median Female Earnings Correlation Summary
| Measurement | Native/Alaskan | Hungarian |
| Minimum | $15,696 | $9,845 |
| Maximum | $46,195 | $67,329 |
| Range | $30,499 | $57,484 |
| Mean | $30,297 | $33,736 |
| Median | $30,121 | $36,875 |
| Interquartile 25% (IQ1) | $27,399 | $24,845 |
| Interquartile 75% (IQ3) | $32,868 | $40,519 |
| Interquartile Range (IQR) | $5,469 | $15,674 |
| Standard Deviation (Sample) | $4,739 | $11,915 |
| Standard Deviation (Population) | $4,727 | $11,798 |
Similar Demographics by Median Female Earnings
Demographics Similar to Natives/Alaskans by Median Female Earnings
In terms of median female earnings, the demographic groups most similar to Natives/Alaskans are Choctaw ($33,775, a difference of 0.090%), Menominee ($33,894, a difference of 0.26%), Hopi ($33,932, a difference of 0.37%), Mexican ($33,664, a difference of 0.42%), and Immigrants from Central America ($33,953, a difference of 0.43%).
| Demographics | Rating | Rank | Median Female Earnings |
| Immigrants | Congo | 0.0 /100 | #324 | Tragic $34,317 |
| Dutch West Indians | 0.0 /100 | #325 | Tragic $34,106 |
| Kiowa | 0.0 /100 | #326 | Tragic $34,074 |
| Cajuns | 0.0 /100 | #327 | Tragic $34,034 |
| Immigrants | Central America | 0.0 /100 | #328 | Tragic $33,953 |
| Hopi | 0.0 /100 | #329 | Tragic $33,932 |
| Menominee | 0.0 /100 | #330 | Tragic $33,894 |
| Natives/Alaskans | 0.0 /100 | #331 | Tragic $33,806 |
| Choctaw | 0.0 /100 | #332 | Tragic $33,775 |
| Mexicans | 0.0 /100 | #333 | Tragic $33,664 |
| Spanish American Indians | 0.0 /100 | #334 | Tragic $33,625 |
| Creek | 0.0 /100 | #335 | Tragic $33,437 |
| Ottawa | 0.0 /100 | #336 | Tragic $33,378 |
| Yakama | 0.0 /100 | #337 | Tragic $33,354 |
| Immigrants | Cuba | 0.0 /100 | #338 | Tragic $33,291 |
Demographics Similar to Hungarians by Median Female Earnings
In terms of median female earnings, the demographic groups most similar to Hungarians are Tlingit-Haida ($39,513, a difference of 0.010%), Tsimshian ($39,530, a difference of 0.050%), Immigrants from Kenya ($39,535, a difference of 0.060%), European ($39,457, a difference of 0.13%), and Immigrants from West Indies ($39,441, a difference of 0.18%).
| Demographics | Rating | Rank | Median Female Earnings |
| Nigerians | 47.0 /100 | #176 | Average $39,641 |
| Costa Ricans | 46.1 /100 | #177 | Average $39,622 |
| Slavs | 45.6 /100 | #178 | Average $39,613 |
| Immigrants | Germany | 45.1 /100 | #179 | Average $39,603 |
| Immigrants | Kenya | 41.6 /100 | #180 | Average $39,535 |
| Tsimshian | 41.4 /100 | #181 | Average $39,530 |
| Tlingit-Haida | 40.5 /100 | #182 | Average $39,513 |
| Hungarians | 40.3 /100 | #183 | Average $39,510 |
| Europeans | 37.7 /100 | #184 | Fair $39,457 |
| Immigrants | West Indies | 36.9 /100 | #185 | Fair $39,441 |
| Colombians | 36.9 /100 | #186 | Fair $39,439 |
| Swedes | 36.0 /100 | #187 | Fair $39,421 |
| Bermudans | 35.9 /100 | #188 | Fair $39,418 |
| Senegalese | 34.2 /100 | #189 | Fair $39,384 |
| Puget Sound Salish | 33.9 /100 | #190 | Fair $39,376 |