Bhutanese vs Hungarian Disability Age Over 75
COMPARE
Bhutanese
Hungarian
Disability Age Over 75
Disability Age Over 75 Comparison
Bhutanese
Hungarians
47.1%
DISABILITY AGE OVER 75
72.6/ 100
METRIC RATING
157th/ 347
METRIC RANK
46.5%
DISABILITY AGE OVER 75
95.3/ 100
METRIC RATING
117th/ 347
METRIC RANK
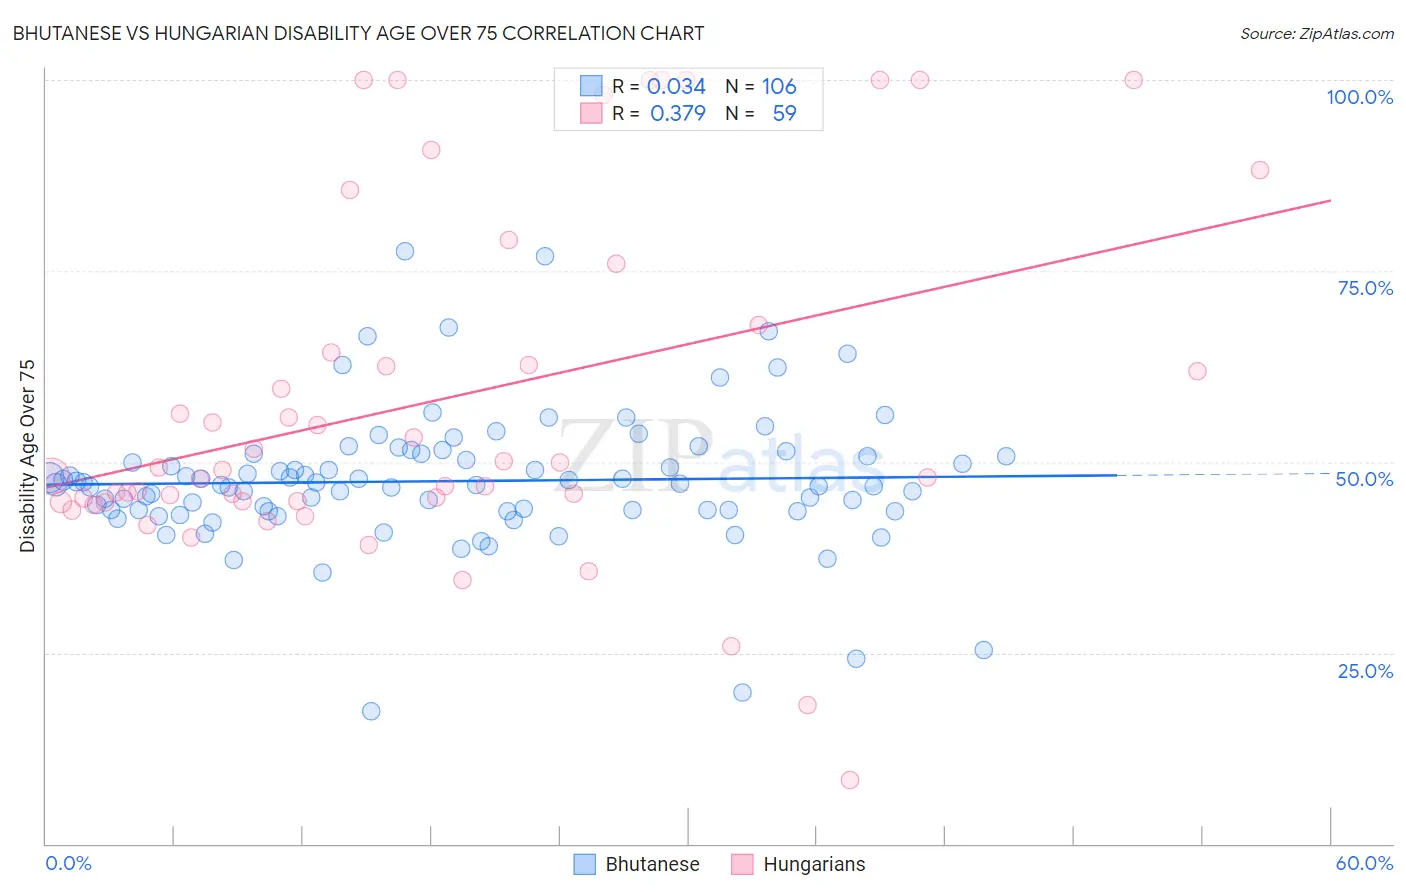
Bhutanese vs Hungarian Disability Age Over 75 Correlation Chart
The statistical analysis conducted on geographies consisting of 454,278,998 people shows no correlation between the proportion of Bhutanese and percentage of population with a disability over the age of 75 in the United States with a correlation coefficient (R) of 0.034 and weighted average of 47.1%. Similarly, the statistical analysis conducted on geographies consisting of 485,150,017 people shows a mild positive correlation between the proportion of Hungarians and percentage of population with a disability over the age of 75 in the United States with a correlation coefficient (R) of 0.379 and weighted average of 46.5%, a difference of 1.2%.
Disability Age Over 75 Correlation Summary
| Measurement | Bhutanese | Hungarian |
| Minimum | 17.3% | 8.3% |
| Maximum | 77.6% | 100.0% |
| Range | 60.2% | 91.7% |
| Mean | 47.5% | 58.0% |
| Median | 47.0% | 48.9% |
| Interquartile 25% (IQ1) | 43.7% | 44.8% |
| Interquartile 75% (IQ3) | 50.7% | 67.9% |
| Interquartile Range (IQR) | 7.1% | 23.1% |
| Standard Deviation (Sample) | 9.0% | 22.8% |
| Standard Deviation (Population) | 8.9% | 22.6% |
Similar Demographics by Disability Age Over 75
Demographics Similar to Bhutanese by Disability Age Over 75
In terms of disability age over 75, the demographic groups most similar to Bhutanese are Arab (47.1%, a difference of 0.020%), Immigrants from Guyana (47.1%, a difference of 0.020%), Immigrants from Morocco (47.1%, a difference of 0.030%), Immigrants from Belarus (47.1%, a difference of 0.060%), and Immigrants from Iran (47.1%, a difference of 0.060%).
| Demographics | Rating | Rank | Disability Age Over 75 |
| Immigrants | Russia | 79.3 /100 | #150 | Good 47.0% |
| French Canadians | 79.0 /100 | #151 | Good 47.0% |
| Immigrants | Asia | 76.5 /100 | #152 | Good 47.0% |
| Immigrants | Zaire | 74.8 /100 | #153 | Good 47.1% |
| Immigrants | Belarus | 74.8 /100 | #154 | Good 47.1% |
| Immigrants | Iran | 74.7 /100 | #155 | Good 47.1% |
| Arabs | 73.3 /100 | #156 | Good 47.1% |
| Bhutanese | 72.6 /100 | #157 | Good 47.1% |
| Immigrants | Guyana | 71.9 /100 | #158 | Good 47.1% |
| Immigrants | Morocco | 71.4 /100 | #159 | Good 47.1% |
| Immigrants | Middle Africa | 68.3 /100 | #160 | Good 47.1% |
| South American Indians | 68.1 /100 | #161 | Good 47.1% |
| Pennsylvania Germans | 66.0 /100 | #162 | Good 47.2% |
| Immigrants | Eastern Africa | 65.5 /100 | #163 | Good 47.2% |
| French | 64.6 /100 | #164 | Good 47.2% |
Demographics Similar to Hungarians by Disability Age Over 75
In terms of disability age over 75, the demographic groups most similar to Hungarians are British (46.5%, a difference of 0.060%), Indian (Asian) (46.5%, a difference of 0.060%), Dutch (46.5%, a difference of 0.080%), Czechoslovakian (46.6%, a difference of 0.080%), and Irish (46.5%, a difference of 0.10%).
| Demographics | Rating | Rank | Disability Age Over 75 |
| Immigrants | Hong Kong | 96.4 /100 | #110 | Exceptional 46.5% |
| Immigrants | Chile | 96.4 /100 | #111 | Exceptional 46.5% |
| Immigrants | Pakistan | 96.1 /100 | #112 | Exceptional 46.5% |
| Irish | 96.0 /100 | #113 | Exceptional 46.5% |
| Dutch | 95.9 /100 | #114 | Exceptional 46.5% |
| British | 95.7 /100 | #115 | Exceptional 46.5% |
| Indians (Asian) | 95.7 /100 | #116 | Exceptional 46.5% |
| Hungarians | 95.3 /100 | #117 | Exceptional 46.5% |
| Czechoslovakians | 94.7 /100 | #118 | Exceptional 46.6% |
| Canadians | 94.4 /100 | #119 | Exceptional 46.6% |
| Immigrants | Nepal | 94.1 /100 | #120 | Exceptional 46.6% |
| Scandinavians | 93.6 /100 | #121 | Exceptional 46.6% |
| Immigrants | Albania | 93.2 /100 | #122 | Exceptional 46.6% |
| Immigrants | Colombia | 92.6 /100 | #123 | Exceptional 46.7% |
| Immigrants | South America | 91.8 /100 | #124 | Exceptional 46.7% |