Moroccan vs Immigrants from Latvia Nursery School
COMPARE
Moroccan
Immigrants from Latvia
Nursery School
Nursery School Comparison
Moroccans
Immigrants from Latvia
97.8%
NURSERY SCHOOL
8.3/ 100
METRIC RATING
213th/ 347
METRIC RANK
98.2%
NURSERY SCHOOL
96.4/ 100
METRIC RATING
113th/ 347
METRIC RANK
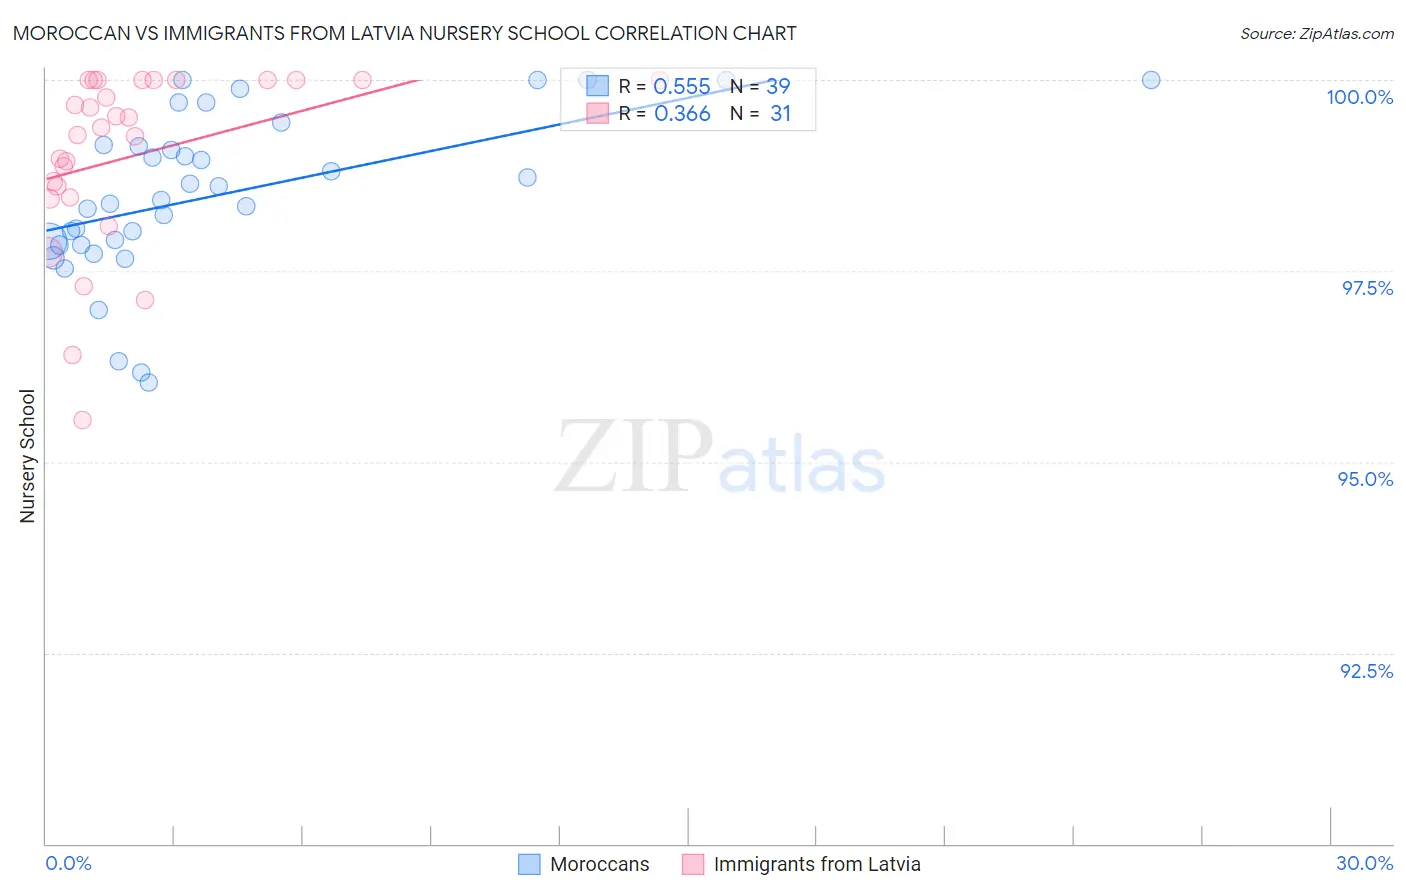
Moroccan vs Immigrants from Latvia Nursery School Correlation Chart
The statistical analysis conducted on geographies consisting of 201,817,667 people shows a substantial positive correlation between the proportion of Moroccans and percentage of population with at least nursery school education in the United States with a correlation coefficient (R) of 0.555 and weighted average of 97.8%. Similarly, the statistical analysis conducted on geographies consisting of 113,735,345 people shows a mild positive correlation between the proportion of Immigrants from Latvia and percentage of population with at least nursery school education in the United States with a correlation coefficient (R) of 0.366 and weighted average of 98.2%, a difference of 0.43%.
Nursery School Correlation Summary
| Measurement | Moroccan | Immigrants from Latvia |
| Minimum | 96.0% | 95.5% |
| Maximum | 100.0% | 100.0% |
| Range | 4.0% | 4.5% |
| Mean | 98.5% | 99.0% |
| Median | 98.4% | 99.4% |
| Interquartile 25% (IQ1) | 97.8% | 98.5% |
| Interquartile 75% (IQ3) | 99.1% | 100.0% |
| Interquartile Range (IQR) | 1.3% | 1.5% |
| Standard Deviation (Sample) | 1.1% | 1.2% |
| Standard Deviation (Population) | 1.0% | 1.1% |
Similar Demographics by Nursery School
Demographics Similar to Moroccans by Nursery School
In terms of nursery school, the demographic groups most similar to Moroccans are Immigrants from Bahamas (97.8%, a difference of 0.0%), South American Indian (97.8%, a difference of 0.0%), Laotian (97.8%, a difference of 0.010%), Bahamian (97.8%, a difference of 0.010%), and Uruguayan (97.8%, a difference of 0.010%).
| Demographics | Rating | Rank | Nursery School |
| Immigrants | Albania | 16.4 /100 | #206 | Poor 97.9% |
| Africans | 15.4 /100 | #207 | Poor 97.9% |
| Immigrants | Northern Africa | 11.7 /100 | #208 | Poor 97.8% |
| Costa Ricans | 11.3 /100 | #209 | Poor 97.8% |
| Immigrants | Oceania | 10.2 /100 | #210 | Poor 97.8% |
| Laotians | 9.8 /100 | #211 | Tragic 97.8% |
| Immigrants | Bahamas | 8.6 /100 | #212 | Tragic 97.8% |
| Moroccans | 8.3 /100 | #213 | Tragic 97.8% |
| South American Indians | 8.0 /100 | #214 | Tragic 97.8% |
| Bahamians | 7.4 /100 | #215 | Tragic 97.8% |
| Uruguayans | 7.1 /100 | #216 | Tragic 97.8% |
| Samoans | 6.3 /100 | #217 | Tragic 97.8% |
| Immigrants | Panama | 5.3 /100 | #218 | Tragic 97.8% |
| Immigrants | Morocco | 5.1 /100 | #219 | Tragic 97.8% |
| Immigrants | Zaire | 4.4 /100 | #220 | Tragic 97.8% |
Demographics Similar to Immigrants from Latvia by Nursery School
In terms of nursery school, the demographic groups most similar to Immigrants from Latvia are Immigrants from Norway (98.2%, a difference of 0.0%), Ute (98.2%, a difference of 0.0%), Iranian (98.2%, a difference of 0.0%), Immigrants from Singapore (98.2%, a difference of 0.010%), and Immigrants from Czechoslovakia (98.2%, a difference of 0.010%).
| Demographics | Rating | Rank | Nursery School |
| Immigrants | Switzerland | 97.3 /100 | #106 | Exceptional 98.2% |
| Basques | 97.3 /100 | #107 | Exceptional 98.2% |
| Pima | 97.1 /100 | #108 | Exceptional 98.2% |
| German Russians | 97.1 /100 | #109 | Exceptional 98.2% |
| Immigrants | Singapore | 96.9 /100 | #110 | Exceptional 98.2% |
| Immigrants | Czechoslovakia | 96.8 /100 | #111 | Exceptional 98.2% |
| Immigrants | Norway | 96.6 /100 | #112 | Exceptional 98.2% |
| Immigrants | Latvia | 96.4 /100 | #113 | Exceptional 98.2% |
| Ute | 96.4 /100 | #114 | Exceptional 98.2% |
| Iranians | 96.3 /100 | #115 | Exceptional 98.2% |
| Spanish | 95.8 /100 | #116 | Exceptional 98.2% |
| Immigrants | France | 95.6 /100 | #117 | Exceptional 98.2% |
| Yugoslavians | 95.4 /100 | #118 | Exceptional 98.2% |
| Thais | 95.0 /100 | #119 | Exceptional 98.2% |
| Okinawans | 94.5 /100 | #120 | Exceptional 98.2% |