Moroccan vs Immigrants from Vietnam Male Disability
COMPARE
Moroccan
Immigrants from Vietnam
Male Disability
Male Disability Comparison
Moroccans
Immigrants from Vietnam
11.0%
MALE DISABILITY
80.7/ 100
METRIC RATING
143rd/ 347
METRIC RANK
10.6%
MALE DISABILITY
97.9/ 100
METRIC RATING
87th/ 347
METRIC RANK
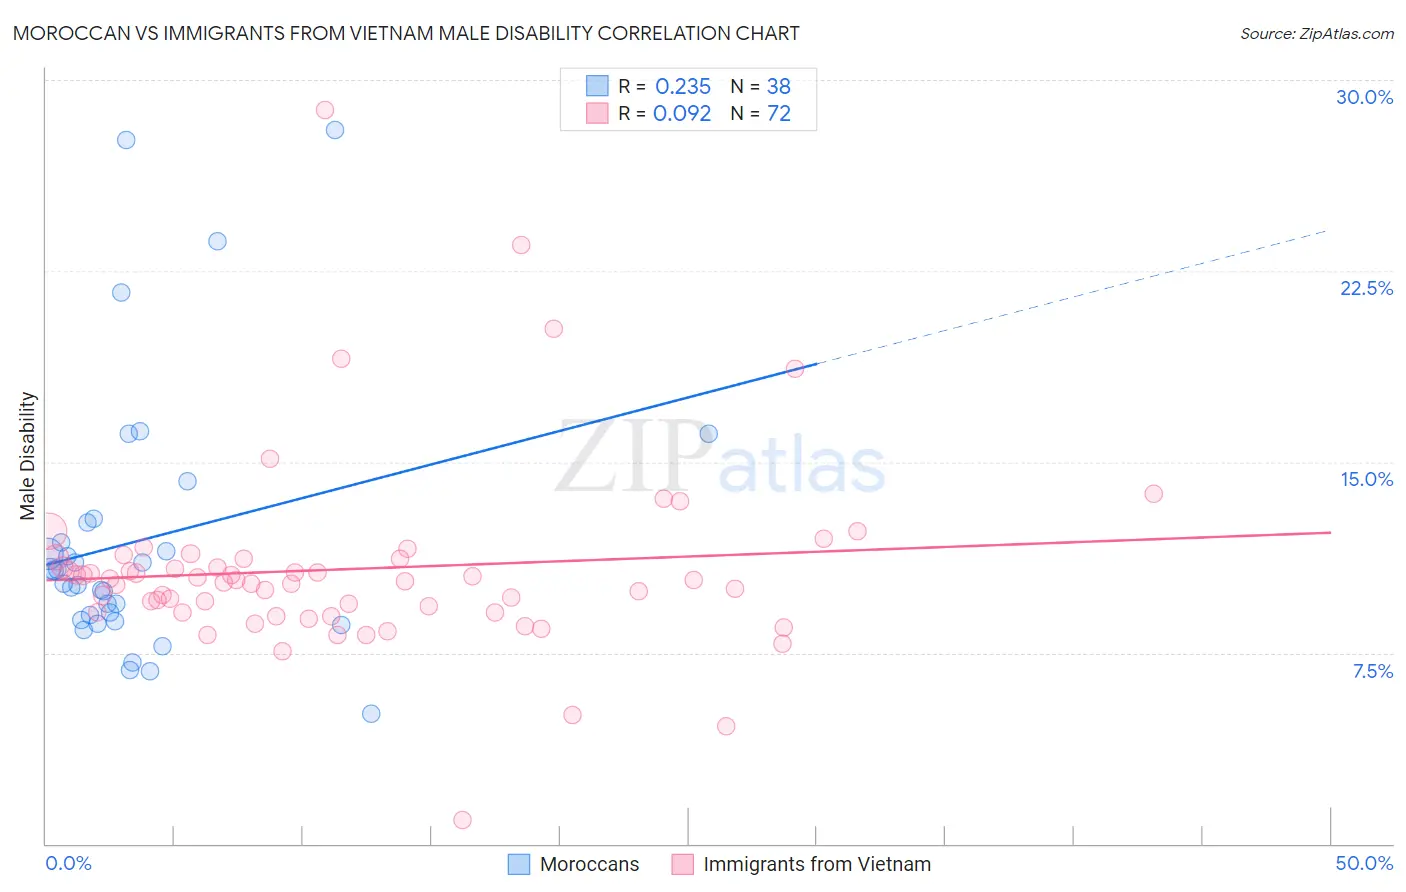
Moroccan vs Immigrants from Vietnam Male Disability Correlation Chart
The statistical analysis conducted on geographies consisting of 201,806,730 people shows a weak positive correlation between the proportion of Moroccans and percentage of males with a disability in the United States with a correlation coefficient (R) of 0.235 and weighted average of 11.0%. Similarly, the statistical analysis conducted on geographies consisting of 404,767,194 people shows a slight positive correlation between the proportion of Immigrants from Vietnam and percentage of males with a disability in the United States with a correlation coefficient (R) of 0.092 and weighted average of 10.6%, a difference of 3.5%.
Male Disability Correlation Summary
| Measurement | Moroccan | Immigrants from Vietnam |
| Minimum | 5.1% | 0.96% |
| Maximum | 28.0% | 28.8% |
| Range | 22.9% | 27.9% |
| Mean | 11.9% | 10.8% |
| Median | 10.5% | 10.3% |
| Interquartile 25% (IQ1) | 8.8% | 9.1% |
| Interquartile 75% (IQ3) | 12.6% | 11.2% |
| Interquartile Range (IQR) | 3.8% | 2.1% |
| Standard Deviation (Sample) | 5.3% | 3.8% |
| Standard Deviation (Population) | 5.2% | 3.8% |
Similar Demographics by Male Disability
Demographics Similar to Moroccans by Male Disability
In terms of male disability, the demographic groups most similar to Moroccans are Immigrants from Italy (11.0%, a difference of 0.070%), Arab (11.0%, a difference of 0.070%), Immigrants from Sudan (11.0%, a difference of 0.070%), South African (11.0%, a difference of 0.090%), and Nigerian (11.0%, a difference of 0.11%).
| Demographics | Rating | Rank | Male Disability |
| Immigrants | Costa Rica | 82.8 /100 | #136 | Excellent 11.0% |
| Immigrants | Europe | 82.0 /100 | #137 | Excellent 11.0% |
| Nigerians | 81.9 /100 | #138 | Excellent 11.0% |
| South Africans | 81.7 /100 | #139 | Excellent 11.0% |
| Immigrants | Italy | 81.5 /100 | #140 | Excellent 11.0% |
| Arabs | 81.5 /100 | #141 | Excellent 11.0% |
| Immigrants | Sudan | 81.5 /100 | #142 | Excellent 11.0% |
| Moroccans | 80.7 /100 | #143 | Excellent 11.0% |
| Kenyans | 78.1 /100 | #144 | Good 11.0% |
| Costa Ricans | 78.0 /100 | #145 | Good 11.0% |
| Koreans | 77.5 /100 | #146 | Good 11.0% |
| Immigrants | Croatia | 77.3 /100 | #147 | Good 11.0% |
| Sudanese | 77.1 /100 | #148 | Good 11.0% |
| Immigrants | Denmark | 76.4 /100 | #149 | Good 11.0% |
| Immigrants | Guatemala | 75.1 /100 | #150 | Good 11.0% |
Demographics Similar to Immigrants from Vietnam by Male Disability
In terms of male disability, the demographic groups most similar to Immigrants from Vietnam are Immigrants from Ireland (10.6%, a difference of 0.020%), Sri Lankan (10.6%, a difference of 0.030%), Immigrants from Western Asia (10.6%, a difference of 0.070%), Immigrants from Nicaragua (10.6%, a difference of 0.070%), and Immigrants from Morocco (10.6%, a difference of 0.12%).
| Demographics | Rating | Rank | Male Disability |
| Immigrants | Jordan | 98.4 /100 | #80 | Exceptional 10.6% |
| Immigrants | Chile | 98.3 /100 | #81 | Exceptional 10.6% |
| Immigrants | Guyana | 98.2 /100 | #82 | Exceptional 10.6% |
| Immigrants | Poland | 98.1 /100 | #83 | Exceptional 10.6% |
| Bulgarians | 98.1 /100 | #84 | Exceptional 10.6% |
| Sri Lankans | 97.9 /100 | #85 | Exceptional 10.6% |
| Immigrants | Ireland | 97.9 /100 | #86 | Exceptional 10.6% |
| Immigrants | Vietnam | 97.9 /100 | #87 | Exceptional 10.6% |
| Immigrants | Western Asia | 97.8 /100 | #88 | Exceptional 10.6% |
| Immigrants | Nicaragua | 97.8 /100 | #89 | Exceptional 10.6% |
| Immigrants | Morocco | 97.7 /100 | #90 | Exceptional 10.6% |
| Immigrants | France | 97.6 /100 | #91 | Exceptional 10.6% |
| Palestinians | 97.4 /100 | #92 | Exceptional 10.7% |
| Immigrants | St. Vincent and the Grenadines | 97.1 /100 | #93 | Exceptional 10.7% |
| Immigrants | Sweden | 96.9 /100 | #94 | Exceptional 10.7% |