Greek vs Immigrants from Grenada Female Disability
COMPARE
Greek
Immigrants from Grenada
Female Disability
Female Disability Comparison
Greeks
Immigrants from Grenada
12.0%
FEMALE DISABILITY
82.0/ 100
METRIC RATING
149th/ 347
METRIC RANK
12.4%
FEMALE DISABILITY
20.5/ 100
METRIC RATING
205th/ 347
METRIC RANK
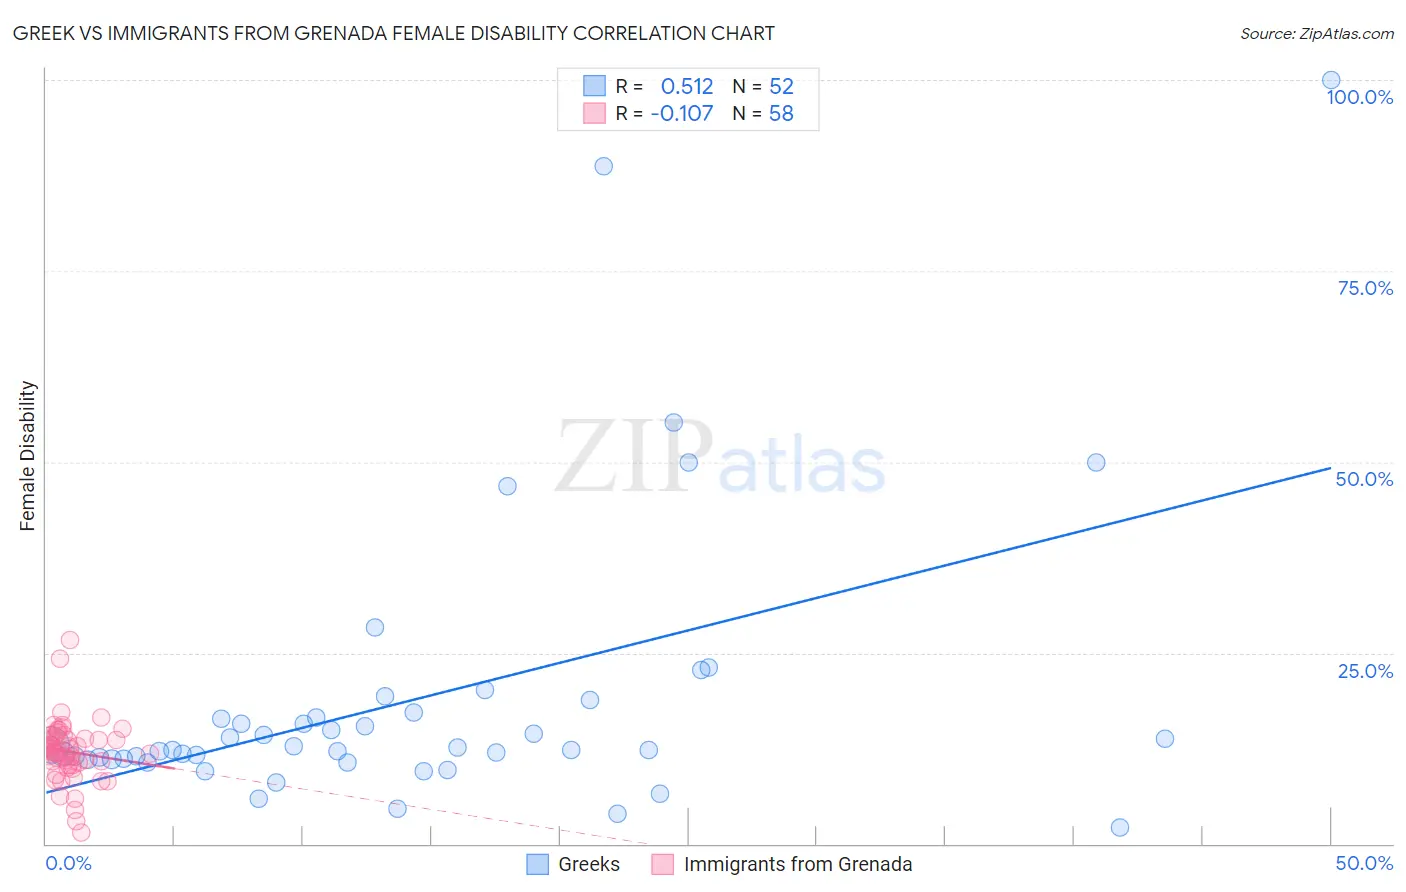
Greek vs Immigrants from Grenada Female Disability Correlation Chart
The statistical analysis conducted on geographies consisting of 482,678,475 people shows a substantial positive correlation between the proportion of Greeks and percentage of females with a disability in the United States with a correlation coefficient (R) of 0.512 and weighted average of 12.0%. Similarly, the statistical analysis conducted on geographies consisting of 67,188,961 people shows a poor negative correlation between the proportion of Immigrants from Grenada and percentage of females with a disability in the United States with a correlation coefficient (R) of -0.107 and weighted average of 12.4%, a difference of 2.7%.
Female Disability Correlation Summary
| Measurement | Greek | Immigrants from Grenada |
| Minimum | 2.2% | 1.4% |
| Maximum | 100.0% | 26.6% |
| Range | 97.8% | 25.2% |
| Mean | 19.0% | 12.0% |
| Median | 12.5% | 12.2% |
| Interquartile 25% (IQ1) | 11.1% | 10.3% |
| Interquartile 75% (IQ3) | 16.9% | 13.7% |
| Interquartile Range (IQR) | 5.8% | 3.4% |
| Standard Deviation (Sample) | 18.9% | 4.0% |
| Standard Deviation (Population) | 18.7% | 4.0% |
Similar Demographics by Female Disability
Demographics Similar to Greeks by Female Disability
In terms of female disability, the demographic groups most similar to Greeks are Immigrants from Moldova (12.0%, a difference of 0.030%), Immigrants from Kenya (12.0%, a difference of 0.070%), Icelander (12.0%, a difference of 0.080%), Nigerian (12.0%, a difference of 0.14%), and Immigrants from Scotland (12.0%, a difference of 0.16%).
| Demographics | Rating | Rank | Female Disability |
| Immigrants | Africa | 90.0 /100 | #142 | Excellent 11.9% |
| Immigrants | Sudan | 89.6 /100 | #143 | Excellent 11.9% |
| Immigrants | Austria | 87.9 /100 | #144 | Excellent 12.0% |
| Estonians | 87.8 /100 | #145 | Excellent 12.0% |
| Pakistanis | 84.6 /100 | #146 | Excellent 12.0% |
| Nigerians | 84.0 /100 | #147 | Excellent 12.0% |
| Immigrants | Kenya | 83.1 /100 | #148 | Excellent 12.0% |
| Greeks | 82.0 /100 | #149 | Excellent 12.0% |
| Immigrants | Moldova | 81.4 /100 | #150 | Excellent 12.0% |
| Icelanders | 80.7 /100 | #151 | Excellent 12.0% |
| Immigrants | Scotland | 79.3 /100 | #152 | Good 12.0% |
| Sudanese | 79.1 /100 | #153 | Good 12.0% |
| Syrians | 76.9 /100 | #154 | Good 12.1% |
| Ghanaians | 76.6 /100 | #155 | Good 12.1% |
| Moroccans | 72.9 /100 | #156 | Good 12.1% |
Demographics Similar to Immigrants from Grenada by Female Disability
In terms of female disability, the demographic groups most similar to Immigrants from Grenada are Immigrants from Zaire (12.3%, a difference of 0.020%), Immigrants from Cuba (12.4%, a difference of 0.020%), Croatian (12.4%, a difference of 0.020%), Immigrants from Barbados (12.3%, a difference of 0.040%), and Somali (12.3%, a difference of 0.060%).
| Demographics | Rating | Rank | Female Disability |
| Mexican American Indians | 24.9 /100 | #198 | Fair 12.3% |
| Immigrants | Trinidad and Tobago | 24.7 /100 | #199 | Fair 12.3% |
| Trinidadians and Tobagonians | 22.4 /100 | #200 | Fair 12.3% |
| Chinese | 22.1 /100 | #201 | Fair 12.3% |
| Somalis | 21.5 /100 | #202 | Fair 12.3% |
| Immigrants | Barbados | 21.1 /100 | #203 | Fair 12.3% |
| Immigrants | Zaire | 20.9 /100 | #204 | Fair 12.3% |
| Immigrants | Grenada | 20.5 /100 | #205 | Fair 12.4% |
| Immigrants | Cuba | 20.2 /100 | #206 | Fair 12.4% |
| Croatians | 20.2 /100 | #207 | Fair 12.4% |
| Basques | 17.5 /100 | #208 | Poor 12.4% |
| Mexicans | 15.7 /100 | #209 | Poor 12.4% |
| Swiss | 14.9 /100 | #210 | Poor 12.4% |
| Immigrants | Bosnia and Herzegovina | 14.8 /100 | #211 | Poor 12.4% |
| Ute | 14.7 /100 | #212 | Poor 12.4% |