Immigrants from Oceania vs Immigrants from Grenada Female Disability
COMPARE
Immigrants from Oceania
Immigrants from Grenada
Female Disability
Female Disability Comparison
Immigrants from Oceania
Immigrants from Grenada
12.1%
FEMALE DISABILITY
61.8/ 100
METRIC RATING
165th/ 347
METRIC RANK
12.4%
FEMALE DISABILITY
20.5/ 100
METRIC RATING
205th/ 347
METRIC RANK
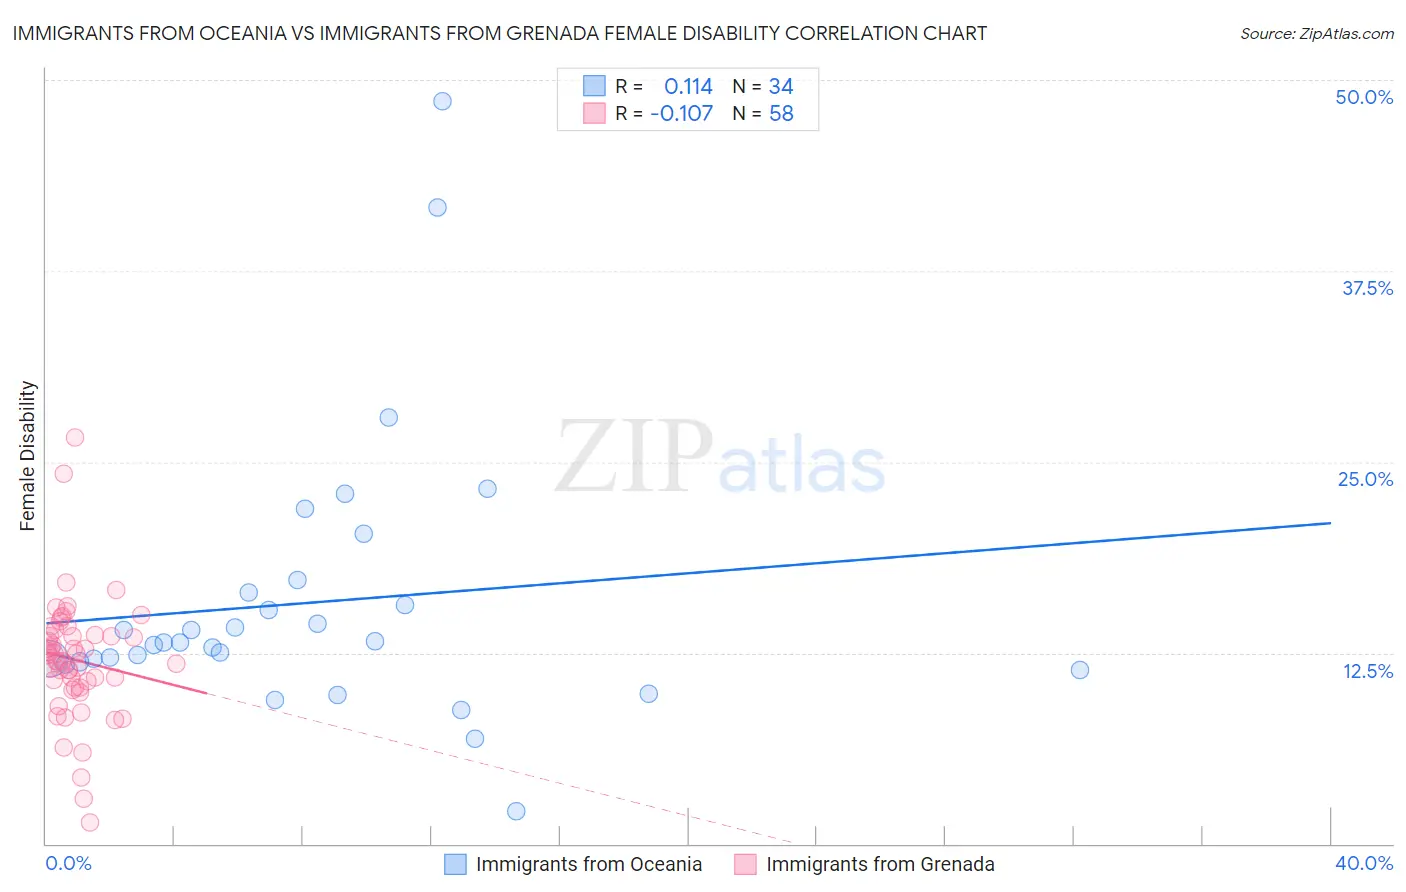
Immigrants from Oceania vs Immigrants from Grenada Female Disability Correlation Chart
The statistical analysis conducted on geographies consisting of 305,480,731 people shows a poor positive correlation between the proportion of Immigrants from Oceania and percentage of females with a disability in the United States with a correlation coefficient (R) of 0.114 and weighted average of 12.1%. Similarly, the statistical analysis conducted on geographies consisting of 67,188,961 people shows a poor negative correlation between the proportion of Immigrants from Grenada and percentage of females with a disability in the United States with a correlation coefficient (R) of -0.107 and weighted average of 12.4%, a difference of 1.7%.
Female Disability Correlation Summary
| Measurement | Immigrants from Oceania | Immigrants from Grenada |
| Minimum | 2.2% | 1.4% |
| Maximum | 48.6% | 26.6% |
| Range | 46.4% | 25.2% |
| Mean | 15.8% | 12.0% |
| Median | 13.2% | 12.2% |
| Interquartile 25% (IQ1) | 11.9% | 10.3% |
| Interquartile 75% (IQ3) | 16.4% | 13.7% |
| Interquartile Range (IQR) | 4.5% | 3.4% |
| Standard Deviation (Sample) | 9.0% | 4.0% |
| Standard Deviation (Population) | 8.8% | 4.0% |
Similar Demographics by Female Disability
Demographics Similar to Immigrants from Oceania by Female Disability
In terms of female disability, the demographic groups most similar to Immigrants from Oceania are Czech (12.1%, a difference of 0.070%), Guatemalan (12.1%, a difference of 0.080%), Lithuanian (12.2%, a difference of 0.090%), Immigrants from Ukraine (12.1%, a difference of 0.10%), and Guyanese (12.1%, a difference of 0.11%).
| Demographics | Rating | Rank | Female Disability |
| Immigrants | Middle Africa | 72.4 /100 | #158 | Good 12.1% |
| Immigrants | Central America | 67.7 /100 | #159 | Good 12.1% |
| Immigrants | Guatemala | 66.0 /100 | #160 | Good 12.1% |
| Guyanese | 64.7 /100 | #161 | Good 12.1% |
| Immigrants | Ukraine | 64.3 /100 | #162 | Good 12.1% |
| Guatemalans | 63.8 /100 | #163 | Good 12.1% |
| Czechs | 63.6 /100 | #164 | Good 12.1% |
| Immigrants | Oceania | 61.8 /100 | #165 | Good 12.1% |
| Lithuanians | 59.5 /100 | #166 | Average 12.2% |
| Immigrants | Latin America | 59.0 /100 | #167 | Average 12.2% |
| Immigrants | Haiti | 58.8 /100 | #168 | Average 12.2% |
| Lebanese | 58.1 /100 | #169 | Average 12.2% |
| Maltese | 57.0 /100 | #170 | Average 12.2% |
| Immigrants | Southern Europe | 56.3 /100 | #171 | Average 12.2% |
| Haitians | 51.9 /100 | #172 | Average 12.2% |
Demographics Similar to Immigrants from Grenada by Female Disability
In terms of female disability, the demographic groups most similar to Immigrants from Grenada are Immigrants from Zaire (12.3%, a difference of 0.020%), Immigrants from Cuba (12.4%, a difference of 0.020%), Croatian (12.4%, a difference of 0.020%), Immigrants from Barbados (12.3%, a difference of 0.040%), and Somali (12.3%, a difference of 0.060%).
| Demographics | Rating | Rank | Female Disability |
| Mexican American Indians | 24.9 /100 | #198 | Fair 12.3% |
| Immigrants | Trinidad and Tobago | 24.7 /100 | #199 | Fair 12.3% |
| Trinidadians and Tobagonians | 22.4 /100 | #200 | Fair 12.3% |
| Chinese | 22.1 /100 | #201 | Fair 12.3% |
| Somalis | 21.5 /100 | #202 | Fair 12.3% |
| Immigrants | Barbados | 21.1 /100 | #203 | Fair 12.3% |
| Immigrants | Zaire | 20.9 /100 | #204 | Fair 12.3% |
| Immigrants | Grenada | 20.5 /100 | #205 | Fair 12.4% |
| Immigrants | Cuba | 20.2 /100 | #206 | Fair 12.4% |
| Croatians | 20.2 /100 | #207 | Fair 12.4% |
| Basques | 17.5 /100 | #208 | Poor 12.4% |
| Mexicans | 15.7 /100 | #209 | Poor 12.4% |
| Swiss | 14.9 /100 | #210 | Poor 12.4% |
| Immigrants | Bosnia and Herzegovina | 14.8 /100 | #211 | Poor 12.4% |
| Ute | 14.7 /100 | #212 | Poor 12.4% |