Alaskan Athabascan vs Immigrants from Grenada Female Disability
COMPARE
Alaskan Athabascan
Immigrants from Grenada
Female Disability
Female Disability Comparison
Alaskan Athabascans
Immigrants from Grenada
13.9%
FEMALE DISABILITY
0.0/ 100
METRIC RATING
315th/ 347
METRIC RANK
12.4%
FEMALE DISABILITY
20.5/ 100
METRIC RATING
205th/ 347
METRIC RANK
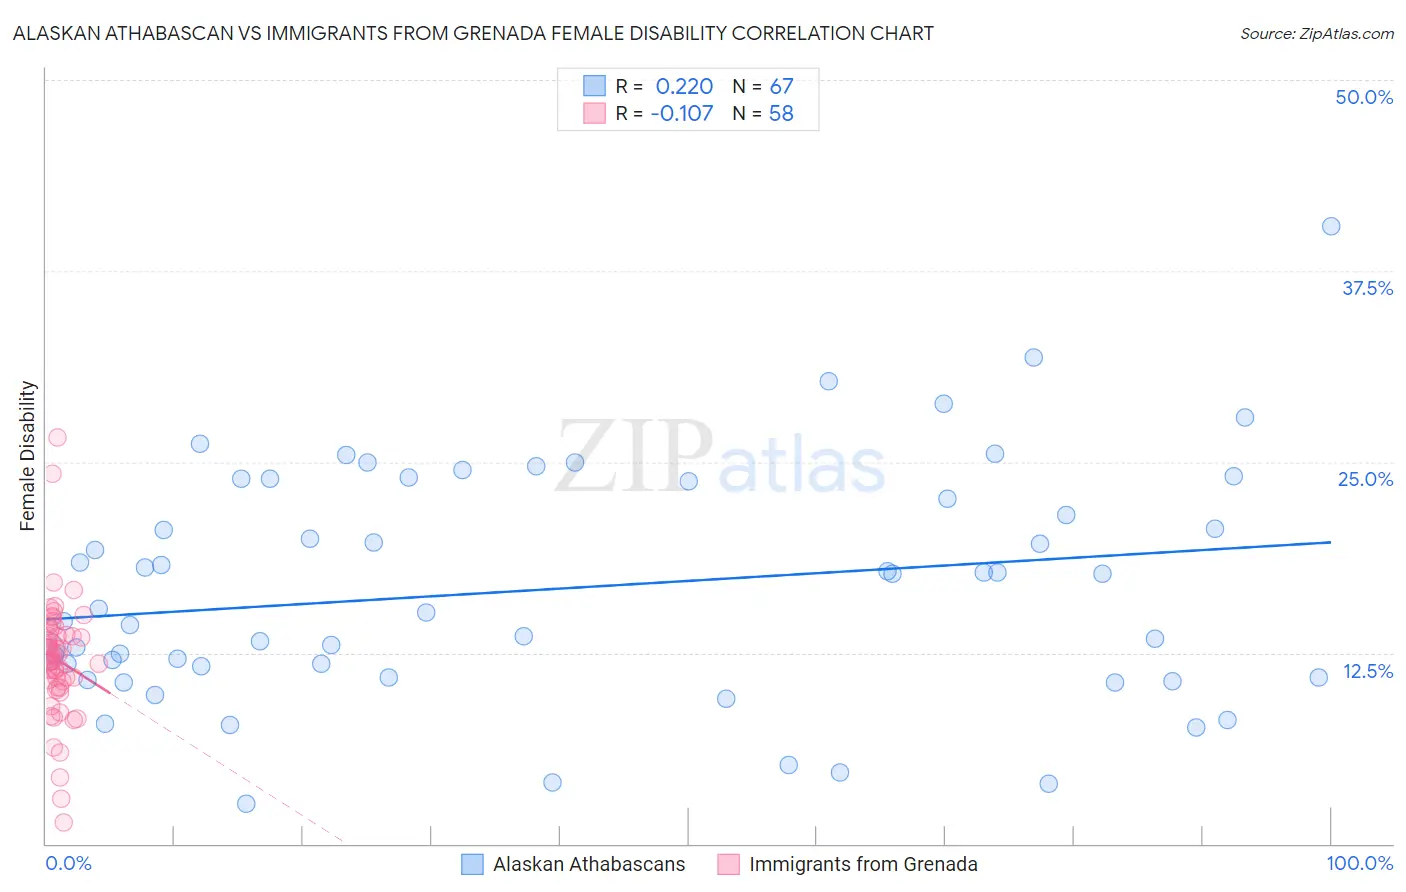
Alaskan Athabascan vs Immigrants from Grenada Female Disability Correlation Chart
The statistical analysis conducted on geographies consisting of 45,817,882 people shows a weak positive correlation between the proportion of Alaskan Athabascans and percentage of females with a disability in the United States with a correlation coefficient (R) of 0.220 and weighted average of 13.9%. Similarly, the statistical analysis conducted on geographies consisting of 67,188,961 people shows a poor negative correlation between the proportion of Immigrants from Grenada and percentage of females with a disability in the United States with a correlation coefficient (R) of -0.107 and weighted average of 12.4%, a difference of 12.8%.
Female Disability Correlation Summary
| Measurement | Alaskan Athabascan | Immigrants from Grenada |
| Minimum | 2.6% | 1.4% |
| Maximum | 40.4% | 26.6% |
| Range | 37.8% | 25.2% |
| Mean | 16.7% | 12.0% |
| Median | 15.4% | 12.2% |
| Interquartile 25% (IQ1) | 10.9% | 10.3% |
| Interquartile 75% (IQ3) | 23.7% | 13.7% |
| Interquartile Range (IQR) | 12.8% | 3.4% |
| Standard Deviation (Sample) | 7.6% | 4.0% |
| Standard Deviation (Population) | 7.6% | 4.0% |
Similar Demographics by Female Disability
Demographics Similar to Alaskan Athabascans by Female Disability
In terms of female disability, the demographic groups most similar to Alaskan Athabascans are Spanish American (14.0%, a difference of 0.36%), Chippewa (14.0%, a difference of 0.47%), Paiute (14.0%, a difference of 0.58%), Puget Sound Salish (13.8%, a difference of 0.59%), and Blackfeet (13.8%, a difference of 0.69%).
| Demographics | Rating | Rank | Female Disability |
| Cree | 0.0 /100 | #308 | Tragic 13.7% |
| French American Indians | 0.0 /100 | #309 | Tragic 13.7% |
| Apache | 0.0 /100 | #310 | Tragic 13.7% |
| Hopi | 0.0 /100 | #311 | Tragic 13.7% |
| Delaware | 0.0 /100 | #312 | Tragic 13.8% |
| Blackfeet | 0.0 /100 | #313 | Tragic 13.8% |
| Puget Sound Salish | 0.0 /100 | #314 | Tragic 13.8% |
| Alaskan Athabascans | 0.0 /100 | #315 | Tragic 13.9% |
| Spanish Americans | 0.0 /100 | #316 | Tragic 14.0% |
| Chippewa | 0.0 /100 | #317 | Tragic 14.0% |
| Paiute | 0.0 /100 | #318 | Tragic 14.0% |
| Iroquois | 0.0 /100 | #319 | Tragic 14.0% |
| Americans | 0.0 /100 | #320 | Tragic 14.1% |
| Potawatomi | 0.0 /100 | #321 | Tragic 14.1% |
| Pueblo | 0.0 /100 | #322 | Tragic 14.1% |
Demographics Similar to Immigrants from Grenada by Female Disability
In terms of female disability, the demographic groups most similar to Immigrants from Grenada are Immigrants from Zaire (12.3%, a difference of 0.020%), Immigrants from Cuba (12.4%, a difference of 0.020%), Croatian (12.4%, a difference of 0.020%), Immigrants from Barbados (12.3%, a difference of 0.040%), and Somali (12.3%, a difference of 0.060%).
| Demographics | Rating | Rank | Female Disability |
| Mexican American Indians | 24.9 /100 | #198 | Fair 12.3% |
| Immigrants | Trinidad and Tobago | 24.7 /100 | #199 | Fair 12.3% |
| Trinidadians and Tobagonians | 22.4 /100 | #200 | Fair 12.3% |
| Chinese | 22.1 /100 | #201 | Fair 12.3% |
| Somalis | 21.5 /100 | #202 | Fair 12.3% |
| Immigrants | Barbados | 21.1 /100 | #203 | Fair 12.3% |
| Immigrants | Zaire | 20.9 /100 | #204 | Fair 12.3% |
| Immigrants | Grenada | 20.5 /100 | #205 | Fair 12.4% |
| Immigrants | Cuba | 20.2 /100 | #206 | Fair 12.4% |
| Croatians | 20.2 /100 | #207 | Fair 12.4% |
| Basques | 17.5 /100 | #208 | Poor 12.4% |
| Mexicans | 15.7 /100 | #209 | Poor 12.4% |
| Swiss | 14.9 /100 | #210 | Poor 12.4% |
| Immigrants | Bosnia and Herzegovina | 14.8 /100 | #211 | Poor 12.4% |
| Ute | 14.7 /100 | #212 | Poor 12.4% |