Moroccan vs Immigrants from Grenada Disability Age Under 5
COMPARE
Moroccan
Immigrants from Grenada
Disability Age Under 5
Disability Age Under 5 Comparison
Moroccans
Immigrants from Grenada
1.2%
DISABILITY AGE UNDER 5
83.6/ 100
METRIC RATING
136th/ 347
METRIC RANK
0.94%
DISABILITY AGE UNDER 5
100.0/ 100
METRIC RATING
12th/ 347
METRIC RANK
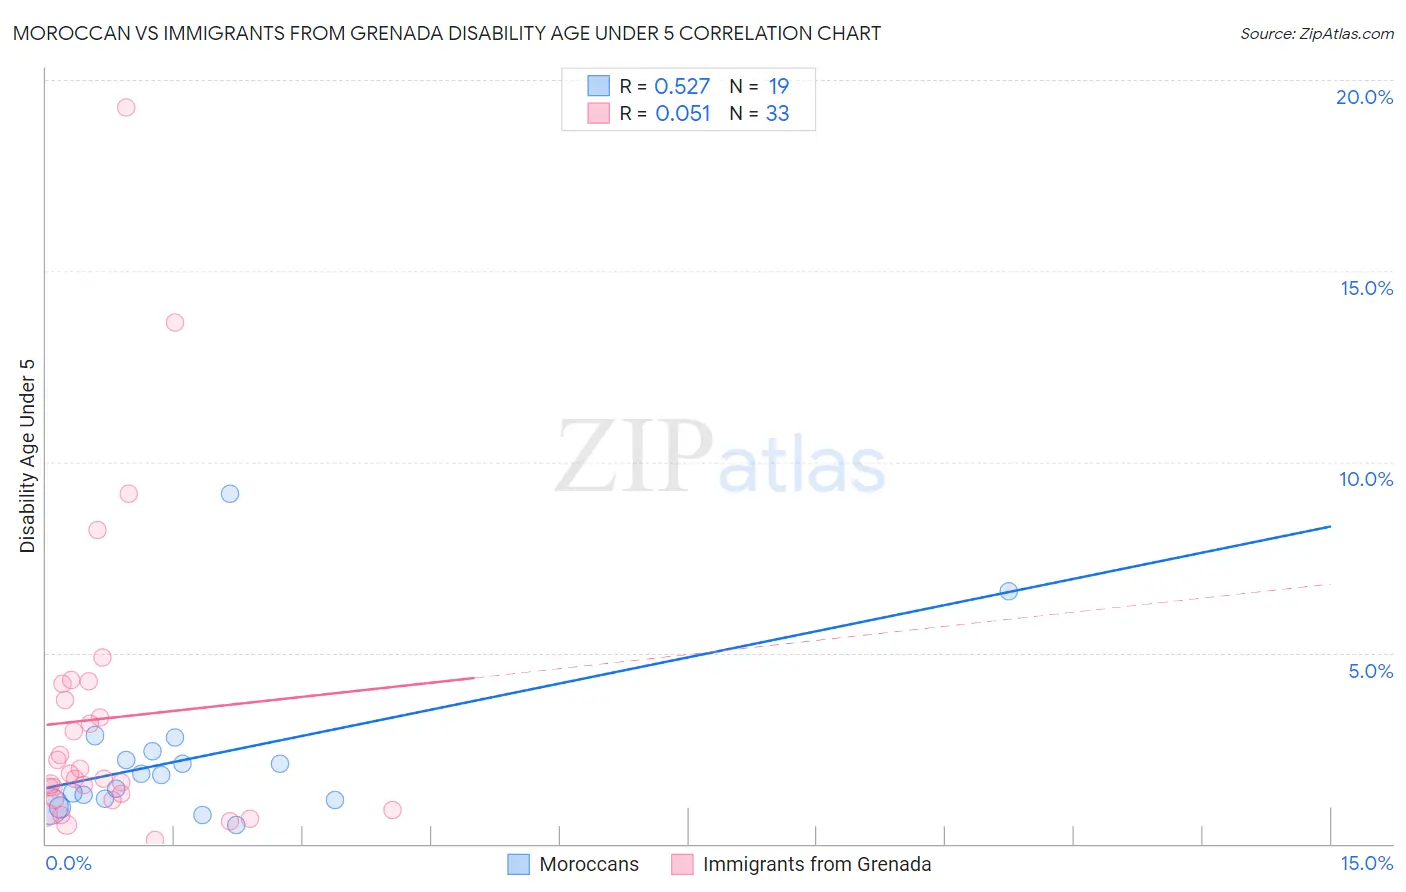
Moroccan vs Immigrants from Grenada Disability Age Under 5 Correlation Chart
The statistical analysis conducted on geographies consisting of 132,015,425 people shows a substantial positive correlation between the proportion of Moroccans and percentage of population with a disability under the age of 5 in the United States with a correlation coefficient (R) of 0.527 and weighted average of 1.2%. Similarly, the statistical analysis conducted on geographies consisting of 49,697,157 people shows a slight positive correlation between the proportion of Immigrants from Grenada and percentage of population with a disability under the age of 5 in the United States with a correlation coefficient (R) of 0.051 and weighted average of 0.94%, a difference of 26.5%.
Disability Age Under 5 Correlation Summary
| Measurement | Moroccan | Immigrants from Grenada |
| Minimum | 0.49% | 0.086% |
| Maximum | 9.2% | 19.3% |
| Range | 8.7% | 19.2% |
| Mean | 2.3% | 3.3% |
| Median | 1.8% | 1.7% |
| Interquartile 25% (IQ1) | 1.2% | 1.1% |
| Interquartile 75% (IQ3) | 2.4% | 4.0% |
| Interquartile Range (IQR) | 1.3% | 2.8% |
| Standard Deviation (Sample) | 2.1% | 4.0% |
| Standard Deviation (Population) | 2.1% | 4.0% |
Similar Demographics by Disability Age Under 5
Demographics Similar to Moroccans by Disability Age Under 5
In terms of disability age under 5, the demographic groups most similar to Moroccans are Immigrants from Eastern Africa (1.2%, a difference of 0.090%), Immigrants from Czechoslovakia (1.2%, a difference of 0.14%), Fijian (1.2%, a difference of 0.18%), New Zealander (1.2%, a difference of 0.37%), and Argentinean (1.2%, a difference of 0.38%).
| Demographics | Rating | Rank | Disability Age Under 5 |
| Immigrants | Immigrants | 88.0 /100 | #129 | Excellent 1.2% |
| Koreans | 87.7 /100 | #130 | Excellent 1.2% |
| Immigrants | Serbia | 87.6 /100 | #131 | Excellent 1.2% |
| Immigrants | Eastern Europe | 87.3 /100 | #132 | Excellent 1.2% |
| Immigrants | Spain | 86.5 /100 | #133 | Excellent 1.2% |
| Argentineans | 85.7 /100 | #134 | Excellent 1.2% |
| Fijians | 84.7 /100 | #135 | Excellent 1.2% |
| Moroccans | 83.6 /100 | #136 | Excellent 1.2% |
| Immigrants | Eastern Africa | 83.1 /100 | #137 | Excellent 1.2% |
| Immigrants | Czechoslovakia | 82.8 /100 | #138 | Excellent 1.2% |
| New Zealanders | 81.4 /100 | #139 | Excellent 1.2% |
| Somalis | 80.8 /100 | #140 | Excellent 1.2% |
| Immigrants | Honduras | 80.4 /100 | #141 | Excellent 1.2% |
| Immigrants | Colombia | 79.3 /100 | #142 | Good 1.2% |
| Alsatians | 79.3 /100 | #143 | Good 1.2% |
Demographics Similar to Immigrants from Grenada by Disability Age Under 5
In terms of disability age under 5, the demographic groups most similar to Immigrants from Grenada are Afghan (0.94%, a difference of 0.020%), Soviet Union (0.95%, a difference of 0.17%), Yuman (0.95%, a difference of 0.24%), Immigrants from Hong Kong (0.95%, a difference of 0.28%), and Marshallese (0.94%, a difference of 0.78%).
| Demographics | Rating | Rank | Disability Age Under 5 |
| Immigrants | Bangladesh | 100.0 /100 | #5 | Exceptional 0.85% |
| Ute | 100.0 /100 | #6 | Exceptional 0.86% |
| Immigrants | Afghanistan | 100.0 /100 | #7 | Exceptional 0.91% |
| Immigrants | Yemen | 100.0 /100 | #8 | Exceptional 0.91% |
| Immigrants | Fiji | 100.0 /100 | #9 | Exceptional 0.92% |
| Marshallese | 100.0 /100 | #10 | Exceptional 0.94% |
| Afghans | 100.0 /100 | #11 | Exceptional 0.94% |
| Immigrants | Grenada | 100.0 /100 | #12 | Exceptional 0.94% |
| Soviet Union | 100.0 /100 | #13 | Exceptional 0.95% |
| Yuman | 100.0 /100 | #14 | Exceptional 0.95% |
| Immigrants | Hong Kong | 100.0 /100 | #15 | Exceptional 0.95% |
| Immigrants | Israel | 100.0 /100 | #16 | Exceptional 0.96% |
| Immigrants | China | 100.0 /100 | #17 | Exceptional 0.96% |
| Immigrants | Barbados | 100.0 /100 | #18 | Exceptional 0.97% |
| Puget Sound Salish | 100.0 /100 | #19 | Exceptional 0.97% |