Moroccan vs Immigrants from Grenada In Labor Force | Age 45-54
COMPARE
Moroccan
Immigrants from Grenada
In Labor Force | Age 45-54
In Labor Force | Age 45-54 Comparison
Moroccans
Immigrants from Grenada
82.5%
IN LABOR FORCE | AGE 45-54
15.7/ 100
METRIC RATING
199th/ 347
METRIC RANK
81.0%
IN LABOR FORCE | AGE 45-54
0.0/ 100
METRIC RATING
281st/ 347
METRIC RANK
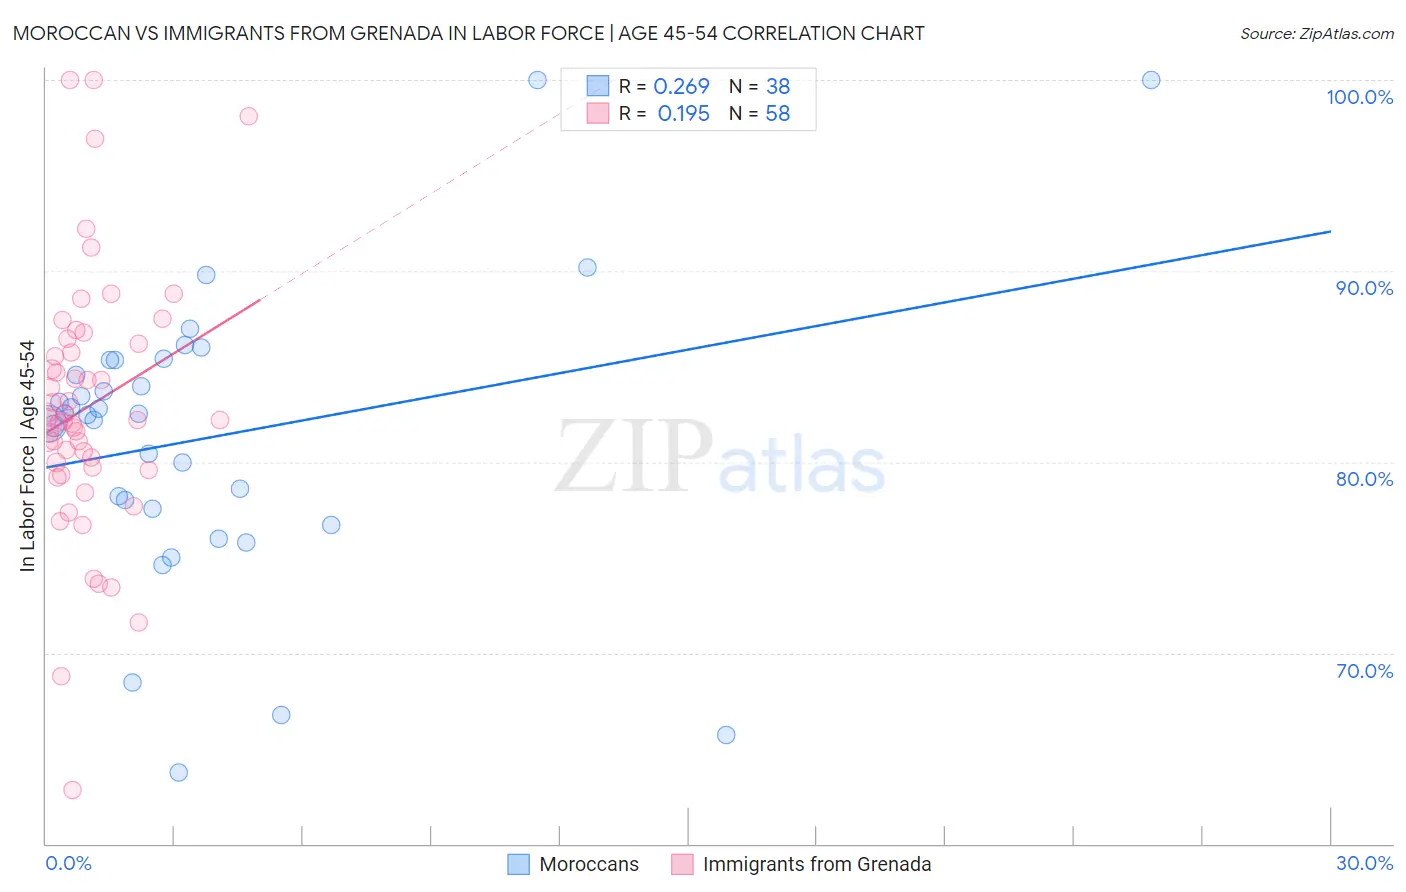
Moroccan vs Immigrants from Grenada In Labor Force | Age 45-54 Correlation Chart
The statistical analysis conducted on geographies consisting of 201,759,404 people shows a weak positive correlation between the proportion of Moroccans and labor force participation rate among population between the ages 45 and 54 in the United States with a correlation coefficient (R) of 0.269 and weighted average of 82.5%. Similarly, the statistical analysis conducted on geographies consisting of 67,184,944 people shows a poor positive correlation between the proportion of Immigrants from Grenada and labor force participation rate among population between the ages 45 and 54 in the United States with a correlation coefficient (R) of 0.195 and weighted average of 81.0%, a difference of 1.8%.
In Labor Force | Age 45-54 Correlation Summary
| Measurement | Moroccan | Immigrants from Grenada |
| Minimum | 63.7% | 62.8% |
| Maximum | 100.0% | 100.0% |
| Range | 36.3% | 37.2% |
| Mean | 81.3% | 82.9% |
| Median | 82.5% | 82.2% |
| Interquartile 25% (IQ1) | 77.6% | 79.7% |
| Interquartile 75% (IQ3) | 85.3% | 86.2% |
| Interquartile Range (IQR) | 7.7% | 6.5% |
| Standard Deviation (Sample) | 7.6% | 6.8% |
| Standard Deviation (Population) | 7.5% | 6.7% |
Similar Demographics by In Labor Force | Age 45-54
Demographics Similar to Moroccans by In Labor Force | Age 45-54
In terms of in labor force | age 45-54, the demographic groups most similar to Moroccans are French Canadian (82.5%, a difference of 0.0%), Canadian (82.4%, a difference of 0.010%), Immigrants from Western Asia (82.4%, a difference of 0.010%), Lebanese (82.5%, a difference of 0.040%), and Immigrants from Denmark (82.5%, a difference of 0.040%).
| Demographics | Rating | Rank | In Labor Force | Age 45-54 |
| Immigrants | Iraq | 20.9 /100 | #192 | Fair 82.5% |
| Australians | 20.8 /100 | #193 | Fair 82.5% |
| Immigrants | Norway | 20.7 /100 | #194 | Fair 82.5% |
| Immigrants | Canada | 20.0 /100 | #195 | Fair 82.5% |
| Immigrants | North America | 18.8 /100 | #196 | Poor 82.5% |
| Lebanese | 18.2 /100 | #197 | Poor 82.5% |
| Immigrants | Denmark | 17.9 /100 | #198 | Poor 82.5% |
| Moroccans | 15.7 /100 | #199 | Poor 82.5% |
| French Canadians | 15.4 /100 | #200 | Poor 82.5% |
| Canadians | 15.1 /100 | #201 | Poor 82.4% |
| Immigrants | Western Asia | 14.9 /100 | #202 | Poor 82.4% |
| Arabs | 11.6 /100 | #203 | Poor 82.4% |
| Immigrants | Western Europe | 10.9 /100 | #204 | Poor 82.4% |
| Senegalese | 9.5 /100 | #205 | Tragic 82.4% |
| Welsh | 9.2 /100 | #206 | Tragic 82.3% |
Demographics Similar to Immigrants from Grenada by In Labor Force | Age 45-54
In terms of in labor force | age 45-54, the demographic groups most similar to Immigrants from Grenada are Immigrants from Latin America (81.0%, a difference of 0.0%), Aleut (81.0%, a difference of 0.070%), Immigrants from Micronesia (81.1%, a difference of 0.11%), Immigrants from Guatemala (81.1%, a difference of 0.12%), and Guatemalan (81.2%, a difference of 0.20%).
| Demographics | Rating | Rank | In Labor Force | Age 45-54 |
| British West Indians | 0.0 /100 | #274 | Tragic 81.2% |
| Immigrants | Nonimmigrants | 0.0 /100 | #275 | Tragic 81.2% |
| U.S. Virgin Islanders | 0.0 /100 | #276 | Tragic 81.2% |
| Guatemalans | 0.0 /100 | #277 | Tragic 81.2% |
| Immigrants | Guatemala | 0.0 /100 | #278 | Tragic 81.1% |
| Immigrants | Micronesia | 0.0 /100 | #279 | Tragic 81.1% |
| Immigrants | Latin America | 0.0 /100 | #280 | Tragic 81.0% |
| Immigrants | Grenada | 0.0 /100 | #281 | Tragic 81.0% |
| Aleuts | 0.0 /100 | #282 | Tragic 81.0% |
| French American Indians | 0.0 /100 | #283 | Tragic 80.8% |
| Belizeans | 0.0 /100 | #284 | Tragic 80.8% |
| Delaware | 0.0 /100 | #285 | Tragic 80.8% |
| Immigrants | Dominica | 0.0 /100 | #286 | Tragic 80.8% |
| Vietnamese | 0.0 /100 | #287 | Tragic 80.8% |
| Cree | 0.0 /100 | #288 | Tragic 80.8% |