Mexican vs Apache Disability Age 5 to 17
COMPARE
Mexican
Apache
Disability Age 5 to 17
Disability Age 5 to 17 Comparison
Mexicans
Apache
5.8%
DISABILITY AGE 5 TO 17
5.7/ 100
METRIC RATING
224th/ 347
METRIC RANK
6.4%
DISABILITY AGE 5 TO 17
0.0/ 100
METRIC RATING
313th/ 347
METRIC RANK
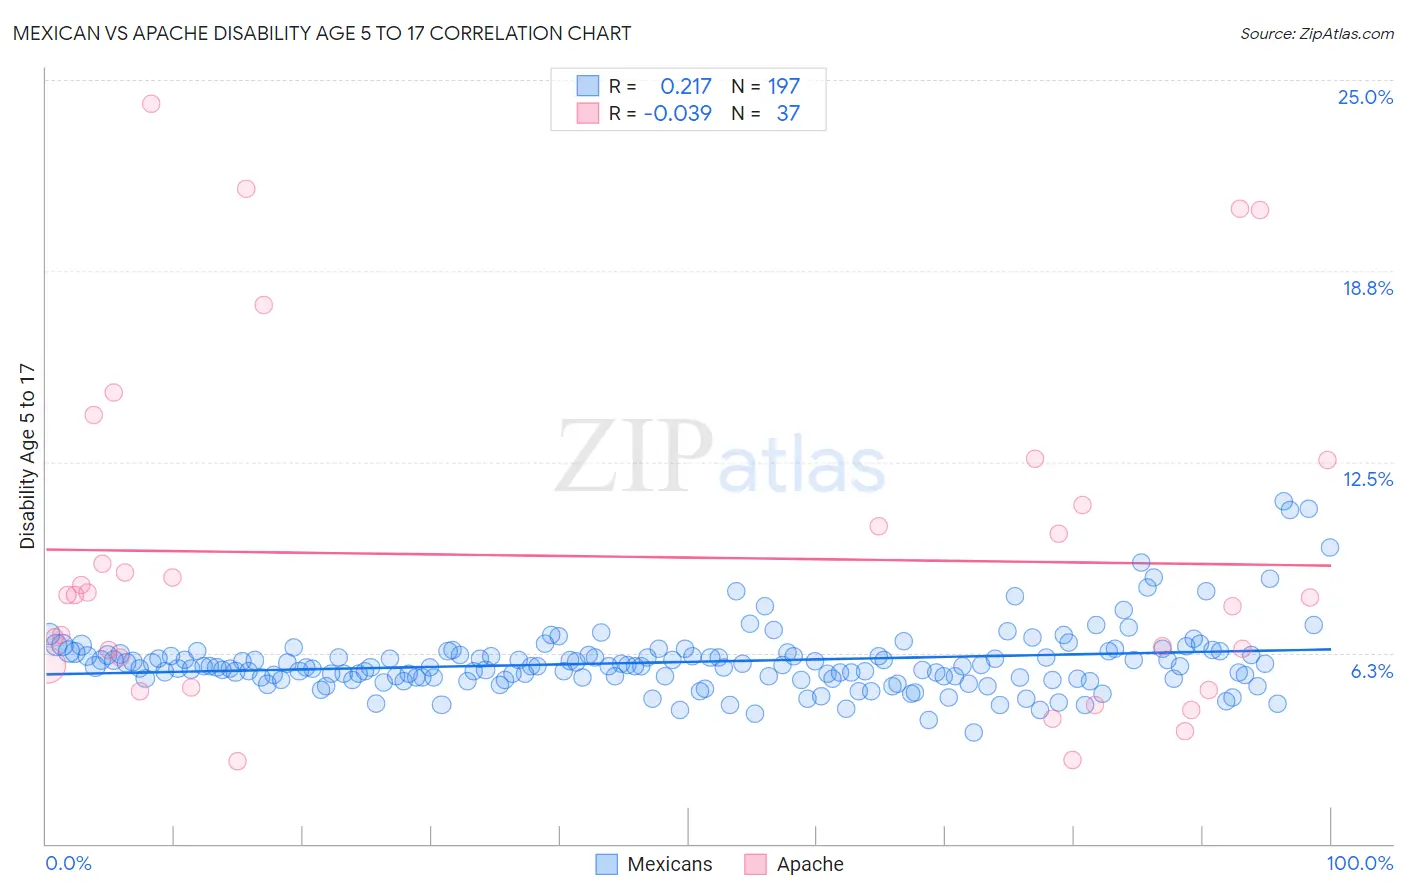
Mexican vs Apache Disability Age 5 to 17 Correlation Chart
The statistical analysis conducted on geographies consisting of 553,305,594 people shows a weak positive correlation between the proportion of Mexicans and percentage of population with a disability between the ages 5 and 17 in the United States with a correlation coefficient (R) of 0.217 and weighted average of 5.8%. Similarly, the statistical analysis conducted on geographies consisting of 229,980,606 people shows no correlation between the proportion of Apache and percentage of population with a disability between the ages 5 and 17 in the United States with a correlation coefficient (R) of -0.039 and weighted average of 6.4%, a difference of 10.1%.
Disability Age 5 to 17 Correlation Summary
| Measurement | Mexican | Apache |
| Minimum | 3.6% | 2.7% |
| Maximum | 11.2% | 24.2% |
| Range | 7.6% | 21.6% |
| Mean | 5.9% | 9.4% |
| Median | 5.8% | 8.2% |
| Interquartile 25% (IQ1) | 5.4% | 5.5% |
| Interquartile 75% (IQ3) | 6.2% | 11.8% |
| Interquartile Range (IQR) | 0.78% | 6.3% |
| Standard Deviation (Sample) | 1.1% | 5.5% |
| Standard Deviation (Population) | 1.1% | 5.4% |
Similar Demographics by Disability Age 5 to 17
Demographics Similar to Mexicans by Disability Age 5 to 17
In terms of disability age 5 to 17, the demographic groups most similar to Mexicans are Guamanian/Chamorro (5.8%, a difference of 0.020%), Alsatian (5.8%, a difference of 0.060%), British West Indian (5.8%, a difference of 0.060%), Swiss (5.8%, a difference of 0.14%), and Lithuanian (5.8%, a difference of 0.21%).
| Demographics | Rating | Rank | Disability Age 5 to 17 |
| Czechs | 7.4 /100 | #217 | Tragic 5.8% |
| Immigrants | Sierra Leone | 7.1 /100 | #218 | Tragic 5.8% |
| Sierra Leoneans | 7.0 /100 | #219 | Tragic 5.8% |
| Belgians | 6.9 /100 | #220 | Tragic 5.8% |
| Lithuanians | 6.7 /100 | #221 | Tragic 5.8% |
| Immigrants | Sudan | 6.7 /100 | #222 | Tragic 5.8% |
| Alsatians | 6.0 /100 | #223 | Tragic 5.8% |
| Mexicans | 5.7 /100 | #224 | Tragic 5.8% |
| Guamanians/Chamorros | 5.6 /100 | #225 | Tragic 5.8% |
| British West Indians | 5.4 /100 | #226 | Tragic 5.8% |
| Swiss | 5.1 /100 | #227 | Tragic 5.8% |
| Haitians | 4.8 /100 | #228 | Tragic 5.8% |
| Bangladeshis | 4.8 /100 | #229 | Tragic 5.8% |
| Ghanaians | 4.7 /100 | #230 | Tragic 5.8% |
| Europeans | 4.5 /100 | #231 | Tragic 5.8% |
Demographics Similar to Apache by Disability Age 5 to 17
In terms of disability age 5 to 17, the demographic groups most similar to Apache are Bermudan (6.4%, a difference of 0.38%), Immigrants from Dominica (6.3%, a difference of 0.49%), French (6.4%, a difference of 0.51%), Alaskan Athabascan (6.3%, a difference of 0.54%), and Hmong (6.3%, a difference of 0.67%).
| Demographics | Rating | Rank | Disability Age 5 to 17 |
| Immigrants | Nonimmigrants | 0.0 /100 | #306 | Tragic 6.3% |
| Bahamians | 0.0 /100 | #307 | Tragic 6.3% |
| Scotch-Irish | 0.0 /100 | #308 | Tragic 6.3% |
| Hmong | 0.0 /100 | #309 | Tragic 6.3% |
| Alaskan Athabascans | 0.0 /100 | #310 | Tragic 6.3% |
| Immigrants | Dominica | 0.0 /100 | #311 | Tragic 6.3% |
| Bermudans | 0.0 /100 | #312 | Tragic 6.4% |
| Apache | 0.0 /100 | #313 | Tragic 6.4% |
| French | 0.0 /100 | #314 | Tragic 6.4% |
| Immigrants | Portugal | 0.0 /100 | #315 | Tragic 6.4% |
| Immigrants | Dominican Republic | 0.0 /100 | #316 | Tragic 6.4% |
| Kiowa | 0.0 /100 | #317 | Tragic 6.4% |
| Comanche | 0.0 /100 | #318 | Tragic 6.4% |
| Delaware | 0.0 /100 | #319 | Tragic 6.5% |
| Africans | 0.0 /100 | #320 | Tragic 6.5% |