Mexican vs Apache Unemployment Among Youth under 25 years
COMPARE
Mexican
Apache
Unemployment Among Youth under 25 years
Unemployment Among Youth under 25 years Comparison
Mexicans
Apache
12.3%
UNEMPLOYMENT AMONG YOUTH UNDER 25 YEARS
0.3/ 100
METRIC RATING
253rd/ 347
METRIC RANK
13.5%
UNEMPLOYMENT AMONG YOUTH UNDER 25 YEARS
0.0/ 100
METRIC RATING
291st/ 347
METRIC RANK
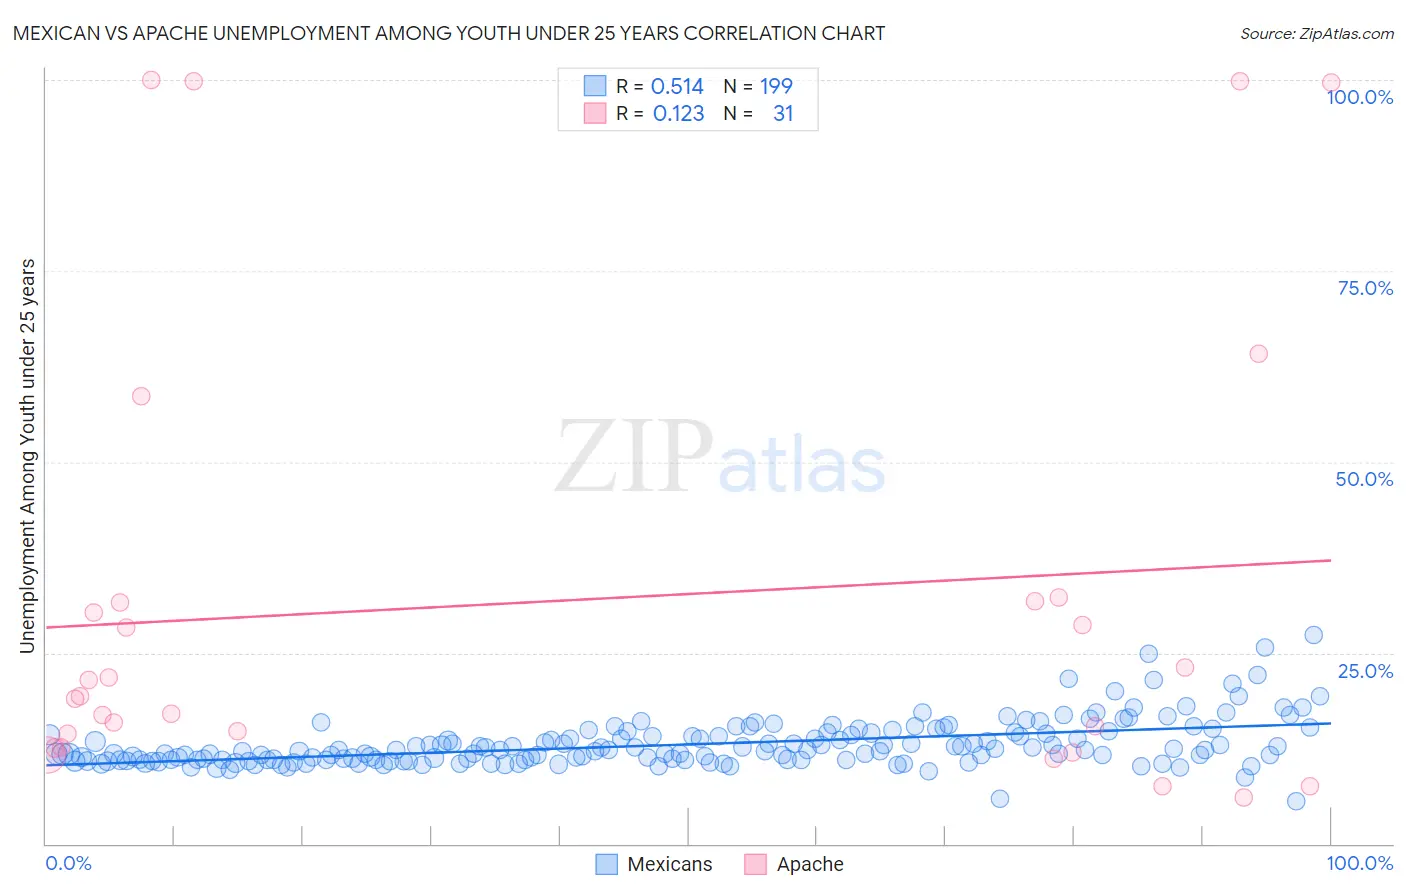
Mexican vs Apache Unemployment Among Youth under 25 years Correlation Chart
The statistical analysis conducted on geographies consisting of 543,925,424 people shows a substantial positive correlation between the proportion of Mexicans and unemployment rate among youth under the age of 25 in the United States with a correlation coefficient (R) of 0.514 and weighted average of 12.3%. Similarly, the statistical analysis conducted on geographies consisting of 229,139,085 people shows a poor positive correlation between the proportion of Apache and unemployment rate among youth under the age of 25 in the United States with a correlation coefficient (R) of 0.123 and weighted average of 13.5%, a difference of 9.5%.
Unemployment Among Youth under 25 years Correlation Summary
| Measurement | Mexican | Apache |
| Minimum | 5.5% | 6.1% |
| Maximum | 27.3% | 100.0% |
| Range | 21.8% | 93.9% |
| Mean | 13.0% | 31.8% |
| Median | 12.2% | 19.3% |
| Interquartile 25% (IQ1) | 11.0% | 12.6% |
| Interquartile 75% (IQ3) | 14.4% | 31.8% |
| Interquartile Range (IQR) | 3.4% | 19.2% |
| Standard Deviation (Sample) | 3.1% | 29.6% |
| Standard Deviation (Population) | 3.1% | 29.1% |
Similar Demographics by Unemployment Among Youth under 25 years
Demographics Similar to Mexicans by Unemployment Among Youth under 25 years
In terms of unemployment among youth under 25 years, the demographic groups most similar to Mexicans are Honduran (12.3%, a difference of 0.020%), Immigrants from Syria (12.3%, a difference of 0.040%), Mexican American Indian (12.3%, a difference of 0.080%), Delaware (12.3%, a difference of 0.11%), and Soviet Union (12.2%, a difference of 0.53%).
| Demographics | Rating | Rank | Unemployment Among Youth under 25 years |
| Immigrants | Honduras | 0.6 /100 | #246 | Tragic 12.2% |
| Immigrants | Greece | 0.6 /100 | #247 | Tragic 12.2% |
| Central Americans | 0.6 /100 | #248 | Tragic 12.2% |
| Soviet Union | 0.6 /100 | #249 | Tragic 12.2% |
| Delaware | 0.4 /100 | #250 | Tragic 12.3% |
| Mexican American Indians | 0.4 /100 | #251 | Tragic 12.3% |
| Immigrants | Syria | 0.3 /100 | #252 | Tragic 12.3% |
| Mexicans | 0.3 /100 | #253 | Tragic 12.3% |
| Hondurans | 0.3 /100 | #254 | Tragic 12.3% |
| Hispanics or Latinos | 0.2 /100 | #255 | Tragic 12.4% |
| Liberians | 0.2 /100 | #256 | Tragic 12.4% |
| Panamanians | 0.2 /100 | #257 | Tragic 12.4% |
| Salvadorans | 0.1 /100 | #258 | Tragic 12.4% |
| Immigrants | Central America | 0.1 /100 | #259 | Tragic 12.4% |
| Immigrants | Panama | 0.1 /100 | #260 | Tragic 12.4% |
Demographics Similar to Apache by Unemployment Among Youth under 25 years
In terms of unemployment among youth under 25 years, the demographic groups most similar to Apache are Central American Indian (13.5%, a difference of 0.030%), Spanish American Indian (13.5%, a difference of 0.14%), Immigrants from Ecuador (13.4%, a difference of 0.25%), Immigrants from Caribbean (13.5%, a difference of 0.31%), and Chippewa (13.5%, a difference of 0.54%).
| Demographics | Rating | Rank | Unemployment Among Youth under 25 years |
| Lumbee | 0.0 /100 | #284 | Tragic 13.3% |
| Ghanaians | 0.0 /100 | #285 | Tragic 13.3% |
| Blackfeet | 0.0 /100 | #286 | Tragic 13.3% |
| Ecuadorians | 0.0 /100 | #287 | Tragic 13.3% |
| Immigrants | Western Africa | 0.0 /100 | #288 | Tragic 13.4% |
| Immigrants | Ghana | 0.0 /100 | #289 | Tragic 13.4% |
| Immigrants | Ecuador | 0.0 /100 | #290 | Tragic 13.4% |
| Apache | 0.0 /100 | #291 | Tragic 13.5% |
| Central American Indians | 0.0 /100 | #292 | Tragic 13.5% |
| Spanish American Indians | 0.0 /100 | #293 | Tragic 13.5% |
| Immigrants | Caribbean | 0.0 /100 | #294 | Tragic 13.5% |
| Chippewa | 0.0 /100 | #295 | Tragic 13.5% |
| Senegalese | 0.0 /100 | #296 | Tragic 13.5% |
| U.S. Virgin Islanders | 0.0 /100 | #297 | Tragic 13.6% |
| Shoshone | 0.0 /100 | #298 | Tragic 13.7% |