Mexican vs Apache 2nd Grade
COMPARE
Mexican
Apache
2nd Grade
2nd Grade Comparison
Mexicans
Apache
96.5%
2ND GRADE
0.0/ 100
METRIC RATING
328th/ 347
METRIC RANK
97.9%
2ND GRADE
74.0/ 100
METRIC RATING
149th/ 347
METRIC RANK
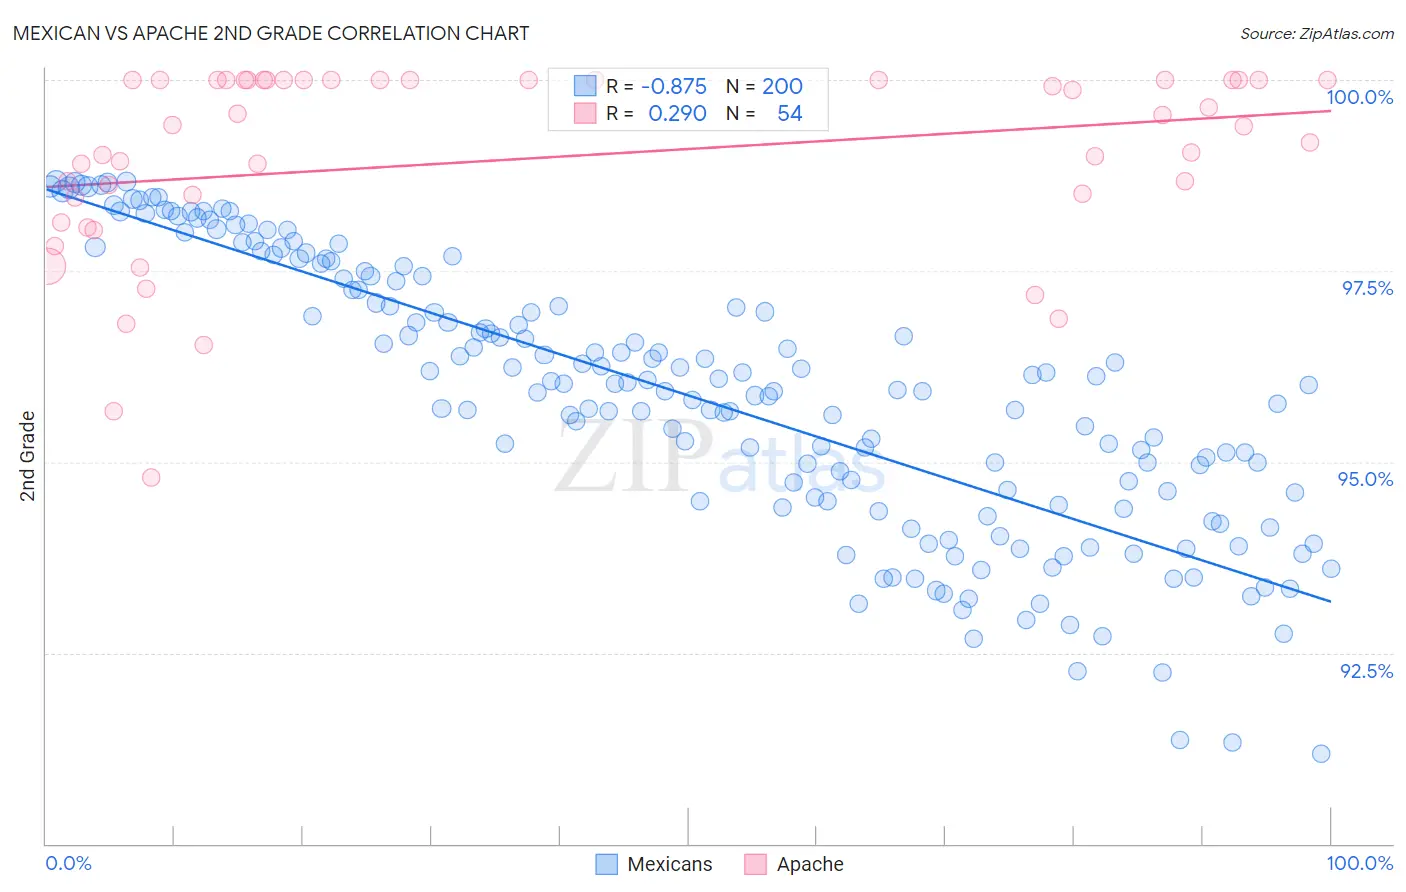
Mexican vs Apache 2nd Grade Correlation Chart
The statistical analysis conducted on geographies consisting of 565,340,458 people shows a very strong negative correlation between the proportion of Mexicans and percentage of population with at least 2nd grade education in the United States with a correlation coefficient (R) of -0.875 and weighted average of 96.5%. Similarly, the statistical analysis conducted on geographies consisting of 231,142,814 people shows a weak positive correlation between the proportion of Apache and percentage of population with at least 2nd grade education in the United States with a correlation coefficient (R) of 0.290 and weighted average of 97.9%, a difference of 1.5%.
2nd Grade Correlation Summary
| Measurement | Mexican | Apache |
| Minimum | 91.2% | 94.8% |
| Maximum | 98.7% | 100.0% |
| Range | 7.5% | 5.2% |
| Mean | 95.9% | 99.0% |
| Median | 96.0% | 99.4% |
| Interquartile 25% (IQ1) | 94.5% | 98.5% |
| Interquartile 75% (IQ3) | 97.4% | 100.0% |
| Interquartile Range (IQR) | 2.9% | 1.5% |
| Standard Deviation (Sample) | 1.8% | 1.3% |
| Standard Deviation (Population) | 1.8% | 1.2% |
Similar Demographics by 2nd Grade
Demographics Similar to Mexicans by 2nd Grade
In terms of 2nd grade, the demographic groups most similar to Mexicans are Immigrants from Vietnam (96.5%, a difference of 0.0%), Japanese (96.5%, a difference of 0.0%), Immigrants from Latin America (96.5%, a difference of 0.010%), Immigrants from Armenia (96.5%, a difference of 0.050%), and Bangladeshi (96.5%, a difference of 0.060%).
| Demographics | Rating | Rank | 2nd Grade |
| Immigrants | Burma/Myanmar | 0.0 /100 | #321 | Tragic 96.7% |
| Immigrants | Bangladesh | 0.0 /100 | #322 | Tragic 96.7% |
| Vietnamese | 0.0 /100 | #323 | Tragic 96.7% |
| Mexican American Indians | 0.0 /100 | #324 | Tragic 96.7% |
| Dominicans | 0.0 /100 | #325 | Tragic 96.6% |
| Immigrants | Honduras | 0.0 /100 | #326 | Tragic 96.6% |
| Immigrants | Vietnam | 0.0 /100 | #327 | Tragic 96.5% |
| Mexicans | 0.0 /100 | #328 | Tragic 96.5% |
| Japanese | 0.0 /100 | #329 | Tragic 96.5% |
| Immigrants | Latin America | 0.0 /100 | #330 | Tragic 96.5% |
| Immigrants | Armenia | 0.0 /100 | #331 | Tragic 96.5% |
| Bangladeshis | 0.0 /100 | #332 | Tragic 96.5% |
| Immigrants | Dominican Republic | 0.0 /100 | #333 | Tragic 96.4% |
| Central Americans | 0.0 /100 | #334 | Tragic 96.4% |
| Yakama | 0.0 /100 | #335 | Tragic 96.4% |
Demographics Similar to Apache by 2nd Grade
In terms of 2nd grade, the demographic groups most similar to Apache are Jordanian (98.0%, a difference of 0.0%), Immigrants from Moldova (97.9%, a difference of 0.0%), Immigrants from Greece (98.0%, a difference of 0.010%), Soviet Union (97.9%, a difference of 0.010%), and Filipino (98.0%, a difference of 0.020%).
| Demographics | Rating | Rank | 2nd Grade |
| Burmese | 81.0 /100 | #142 | Excellent 98.0% |
| Alsatians | 80.5 /100 | #143 | Excellent 98.0% |
| Hmong | 80.0 /100 | #144 | Good 98.0% |
| Filipinos | 79.2 /100 | #145 | Good 98.0% |
| Immigrants | Israel | 78.0 /100 | #146 | Good 98.0% |
| Immigrants | Greece | 76.8 /100 | #147 | Good 98.0% |
| Jordanians | 74.5 /100 | #148 | Good 98.0% |
| Apache | 74.0 /100 | #149 | Good 97.9% |
| Immigrants | Moldova | 72.9 /100 | #150 | Good 97.9% |
| Soviet Union | 70.7 /100 | #151 | Good 97.9% |
| Immigrants | North Macedonia | 68.5 /100 | #152 | Good 97.9% |
| Immigrants | South Central Asia | 68.3 /100 | #153 | Good 97.9% |
| Marshallese | 67.7 /100 | #154 | Good 97.9% |
| French American Indians | 64.3 /100 | #155 | Good 97.9% |
| Dutch West Indians | 63.8 /100 | #156 | Good 97.9% |