Immigrants from Afghanistan vs Apache Disability Age 5 to 17
COMPARE
Immigrants from Afghanistan
Apache
Disability Age 5 to 17
Disability Age 5 to 17 Comparison
Immigrants from Afghanistan
Apache
5.3%
DISABILITY AGE 5 TO 17
97.4/ 100
METRIC RATING
117th/ 347
METRIC RANK
6.4%
DISABILITY AGE 5 TO 17
0.0/ 100
METRIC RATING
313th/ 347
METRIC RANK
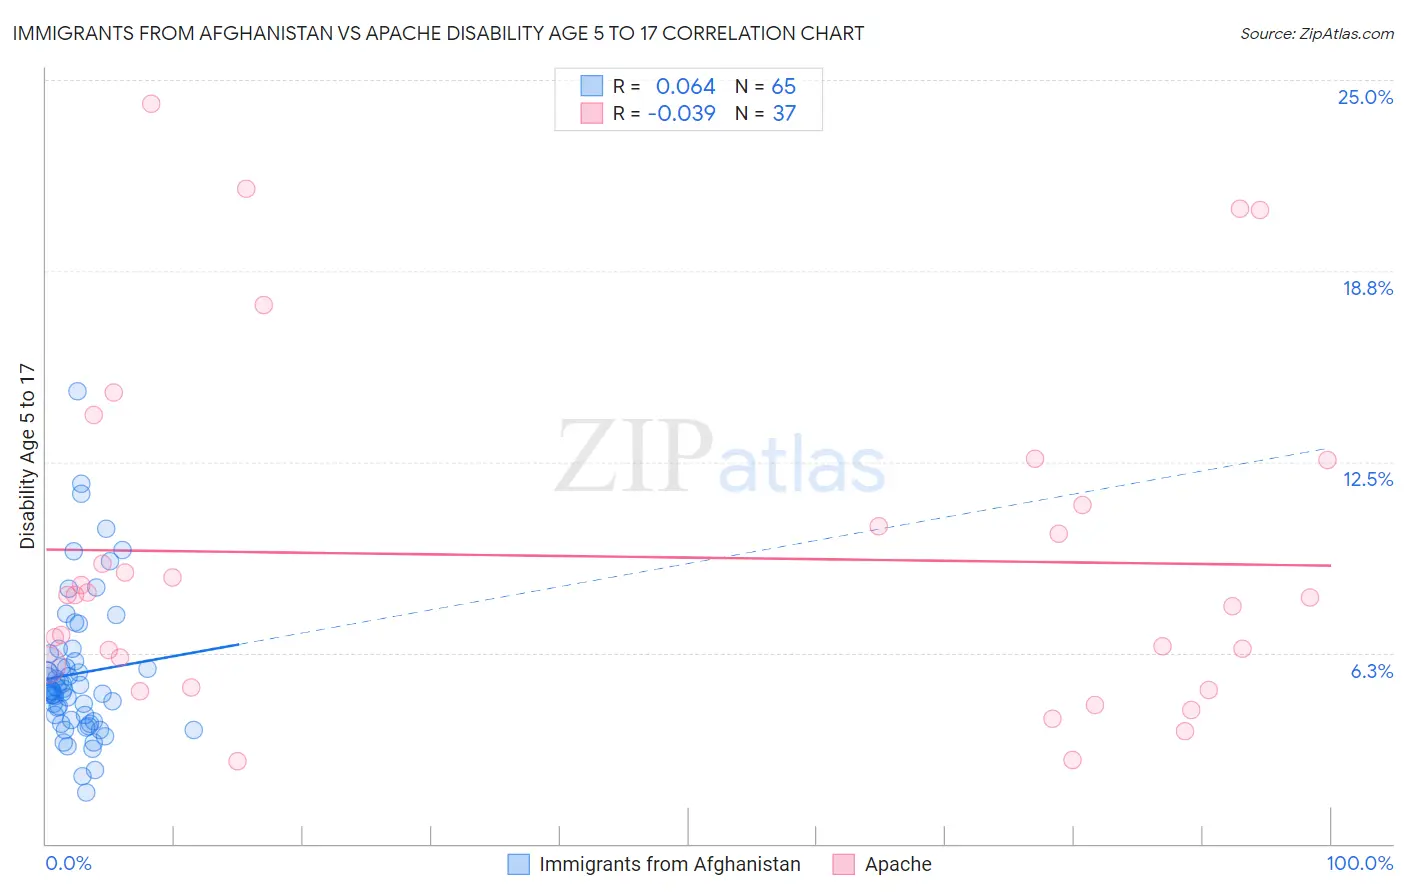
Immigrants from Afghanistan vs Apache Disability Age 5 to 17 Correlation Chart
The statistical analysis conducted on geographies consisting of 147,197,309 people shows a slight positive correlation between the proportion of Immigrants from Afghanistan and percentage of population with a disability between the ages 5 and 17 in the United States with a correlation coefficient (R) of 0.064 and weighted average of 5.3%. Similarly, the statistical analysis conducted on geographies consisting of 229,980,606 people shows no correlation between the proportion of Apache and percentage of population with a disability between the ages 5 and 17 in the United States with a correlation coefficient (R) of -0.039 and weighted average of 6.4%, a difference of 19.2%.
Disability Age 5 to 17 Correlation Summary
| Measurement | Immigrants from Afghanistan | Apache |
| Minimum | 1.7% | 2.7% |
| Maximum | 14.8% | 24.2% |
| Range | 13.1% | 21.6% |
| Mean | 5.6% | 9.4% |
| Median | 5.0% | 8.2% |
| Interquartile 25% (IQ1) | 4.0% | 5.5% |
| Interquartile 75% (IQ3) | 6.1% | 11.8% |
| Interquartile Range (IQR) | 2.1% | 6.3% |
| Standard Deviation (Sample) | 2.4% | 5.5% |
| Standard Deviation (Population) | 2.4% | 5.4% |
Similar Demographics by Disability Age 5 to 17
Demographics Similar to Immigrants from Afghanistan by Disability Age 5 to 17
In terms of disability age 5 to 17, the demographic groups most similar to Immigrants from Afghanistan are South American (5.4%, a difference of 0.11%), Immigrants from South America (5.4%, a difference of 0.11%), Cypriot (5.3%, a difference of 0.16%), Immigrants (5.4%, a difference of 0.17%), and Cuban (5.3%, a difference of 0.23%).
| Demographics | Rating | Rank | Disability Age 5 to 17 |
| Immigrants | Eritrea | 98.0 /100 | #110 | Exceptional 5.3% |
| Ethiopians | 97.9 /100 | #111 | Exceptional 5.3% |
| Immigrants | Latvia | 97.9 /100 | #112 | Exceptional 5.3% |
| Aleuts | 97.8 /100 | #113 | Exceptional 5.3% |
| Immigrants | Northern Europe | 97.8 /100 | #114 | Exceptional 5.3% |
| Cubans | 97.8 /100 | #115 | Exceptional 5.3% |
| Cypriots | 97.7 /100 | #116 | Exceptional 5.3% |
| Immigrants | Afghanistan | 97.4 /100 | #117 | Exceptional 5.3% |
| South Americans | 97.1 /100 | #118 | Exceptional 5.4% |
| Immigrants | South America | 97.1 /100 | #119 | Exceptional 5.4% |
| Immigrants | Immigrants | 97.0 /100 | #120 | Exceptional 5.4% |
| Maltese | 96.0 /100 | #121 | Exceptional 5.4% |
| Chileans | 95.8 /100 | #122 | Exceptional 5.4% |
| Immigrants | Ethiopia | 95.5 /100 | #123 | Exceptional 5.4% |
| Crow | 95.0 /100 | #124 | Exceptional 5.4% |
Demographics Similar to Apache by Disability Age 5 to 17
In terms of disability age 5 to 17, the demographic groups most similar to Apache are Bermudan (6.4%, a difference of 0.38%), Immigrants from Dominica (6.3%, a difference of 0.49%), French (6.4%, a difference of 0.51%), Alaskan Athabascan (6.3%, a difference of 0.54%), and Hmong (6.3%, a difference of 0.67%).
| Demographics | Rating | Rank | Disability Age 5 to 17 |
| Immigrants | Nonimmigrants | 0.0 /100 | #306 | Tragic 6.3% |
| Bahamians | 0.0 /100 | #307 | Tragic 6.3% |
| Scotch-Irish | 0.0 /100 | #308 | Tragic 6.3% |
| Hmong | 0.0 /100 | #309 | Tragic 6.3% |
| Alaskan Athabascans | 0.0 /100 | #310 | Tragic 6.3% |
| Immigrants | Dominica | 0.0 /100 | #311 | Tragic 6.3% |
| Bermudans | 0.0 /100 | #312 | Tragic 6.4% |
| Apache | 0.0 /100 | #313 | Tragic 6.4% |
| French | 0.0 /100 | #314 | Tragic 6.4% |
| Immigrants | Portugal | 0.0 /100 | #315 | Tragic 6.4% |
| Immigrants | Dominican Republic | 0.0 /100 | #316 | Tragic 6.4% |
| Kiowa | 0.0 /100 | #317 | Tragic 6.4% |
| Comanche | 0.0 /100 | #318 | Tragic 6.4% |
| Delaware | 0.0 /100 | #319 | Tragic 6.5% |
| Africans | 0.0 /100 | #320 | Tragic 6.5% |