Menominee vs Hmong Disability
COMPARE
Menominee
Hmong
Disability
Disability Comparison
Menominee
Hmong
13.8%
DISABILITY
0.0/ 100
METRIC RATING
318th/ 347
METRIC RANK
12.8%
DISABILITY
0.0/ 100
METRIC RATING
276th/ 347
METRIC RANK
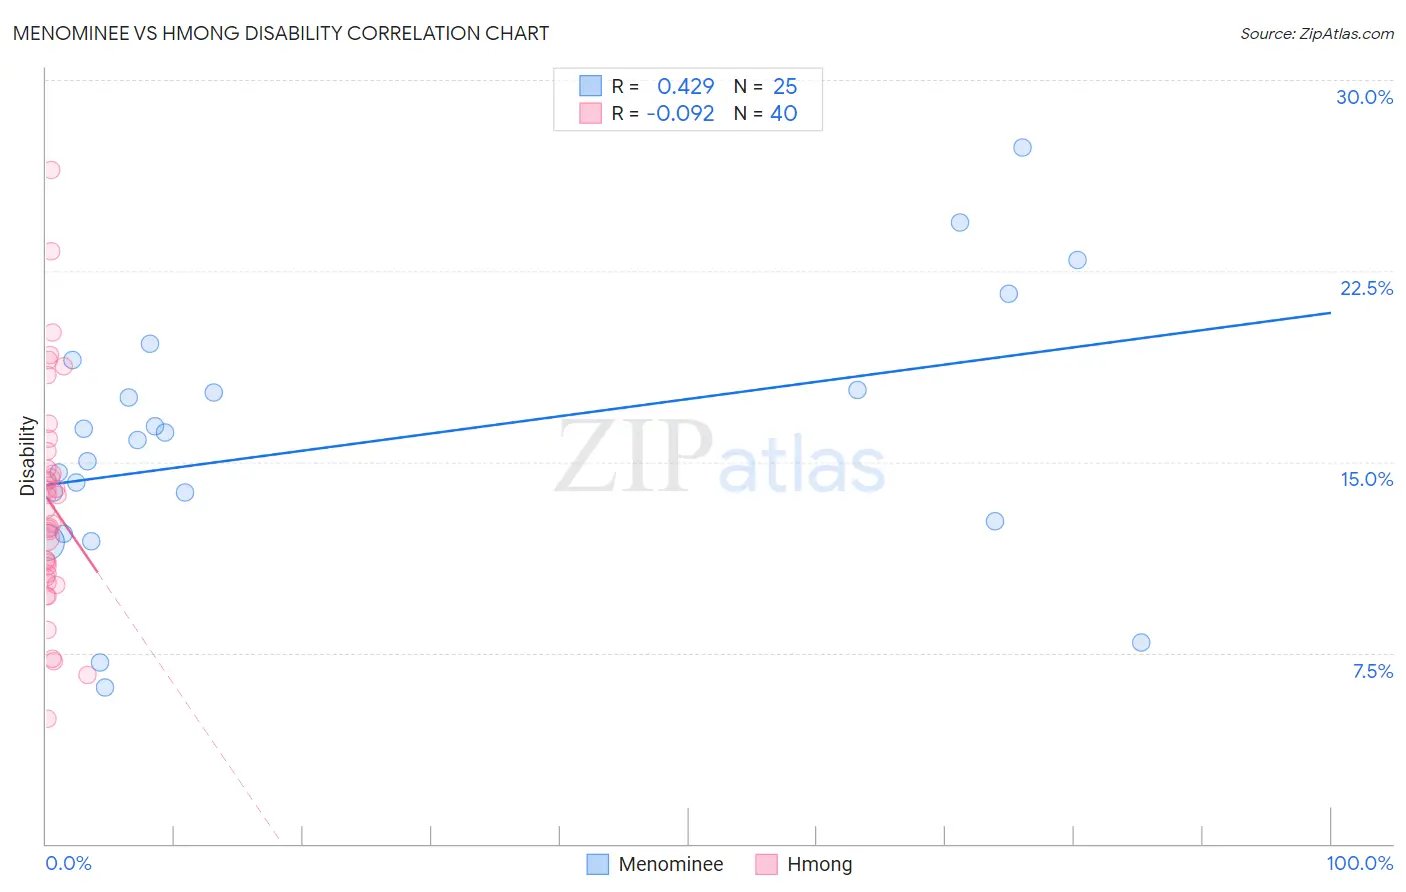
Menominee vs Hmong Disability Correlation Chart
The statistical analysis conducted on geographies consisting of 45,777,730 people shows a moderate positive correlation between the proportion of Menominee and percentage of population with a disability in the United States with a correlation coefficient (R) of 0.429 and weighted average of 13.8%. Similarly, the statistical analysis conducted on geographies consisting of 24,681,537 people shows a slight negative correlation between the proportion of Hmong and percentage of population with a disability in the United States with a correlation coefficient (R) of -0.092 and weighted average of 12.8%, a difference of 7.7%.
Disability Correlation Summary
| Measurement | Menominee | Hmong |
| Minimum | 6.2% | 4.9% |
| Maximum | 27.3% | 26.4% |
| Range | 21.2% | 21.5% |
| Mean | 15.8% | 13.4% |
| Median | 15.9% | 12.8% |
| Interquartile 25% (IQ1) | 12.4% | 10.5% |
| Interquartile 75% (IQ3) | 18.4% | 15.1% |
| Interquartile Range (IQR) | 6.0% | 4.5% |
| Standard Deviation (Sample) | 5.1% | 4.4% |
| Standard Deviation (Population) | 5.0% | 4.4% |
Similar Demographics by Disability
Demographics Similar to Menominee by Disability
In terms of disability, the demographic groups most similar to Menominee are Iroquois (13.8%, a difference of 0.21%), Apache (13.9%, a difference of 0.51%), Pima (13.7%, a difference of 0.58%), Immigrants from Cabo Verde (13.7%, a difference of 0.58%), and Puget Sound Salish (13.7%, a difference of 0.60%).
| Demographics | Rating | Rank | Disability |
| Delaware | 0.0 /100 | #311 | Tragic 13.6% |
| Spanish Americans | 0.0 /100 | #312 | Tragic 13.6% |
| Cree | 0.0 /100 | #313 | Tragic 13.7% |
| Blacks/African Americans | 0.0 /100 | #314 | Tragic 13.7% |
| Puget Sound Salish | 0.0 /100 | #315 | Tragic 13.7% |
| Pima | 0.0 /100 | #316 | Tragic 13.7% |
| Immigrants | Cabo Verde | 0.0 /100 | #317 | Tragic 13.7% |
| Menominee | 0.0 /100 | #318 | Tragic 13.8% |
| Iroquois | 0.0 /100 | #319 | Tragic 13.8% |
| Apache | 0.0 /100 | #320 | Tragic 13.9% |
| Paiute | 0.0 /100 | #321 | Tragic 13.9% |
| Americans | 0.0 /100 | #322 | Tragic 13.9% |
| Comanche | 0.0 /100 | #323 | Tragic 14.1% |
| Chippewa | 0.0 /100 | #324 | Tragic 14.1% |
| Natives/Alaskans | 0.0 /100 | #325 | Tragic 14.2% |
Demographics Similar to Hmong by Disability
In terms of disability, the demographic groups most similar to Hmong are Dutch (12.8%, a difference of 0.050%), Sioux (12.8%, a difference of 0.15%), German (12.8%, a difference of 0.22%), Nepalese (12.8%, a difference of 0.23%), and Fijian (12.8%, a difference of 0.31%).
| Demographics | Rating | Rank | Disability |
| Immigrants | Dominican Republic | 0.1 /100 | #269 | Tragic 12.6% |
| Portuguese | 0.1 /100 | #270 | Tragic 12.6% |
| Immigrants | Yemen | 0.1 /100 | #271 | Tragic 12.6% |
| Dominicans | 0.0 /100 | #272 | Tragic 12.7% |
| Finns | 0.0 /100 | #273 | Tragic 12.7% |
| Nepalese | 0.0 /100 | #274 | Tragic 12.8% |
| Sioux | 0.0 /100 | #275 | Tragic 12.8% |
| Hmong | 0.0 /100 | #276 | Tragic 12.8% |
| Dutch | 0.0 /100 | #277 | Tragic 12.8% |
| Germans | 0.0 /100 | #278 | Tragic 12.8% |
| Fijians | 0.0 /100 | #279 | Tragic 12.8% |
| Spanish | 0.0 /100 | #280 | Tragic 12.8% |
| Immigrants | Portugal | 0.0 /100 | #281 | Tragic 12.9% |
| Scottish | 0.0 /100 | #282 | Tragic 12.9% |
| Irish | 0.0 /100 | #283 | Tragic 12.9% |