Menominee vs Pennsylvania German Disability
COMPARE
Menominee
Pennsylvania German
Disability
Disability Comparison
Menominee
Pennsylvania Germans
13.8%
DISABILITY
0.0/ 100
METRIC RATING
318th/ 347
METRIC RANK
13.2%
DISABILITY
0.0/ 100
METRIC RATING
300th/ 347
METRIC RANK
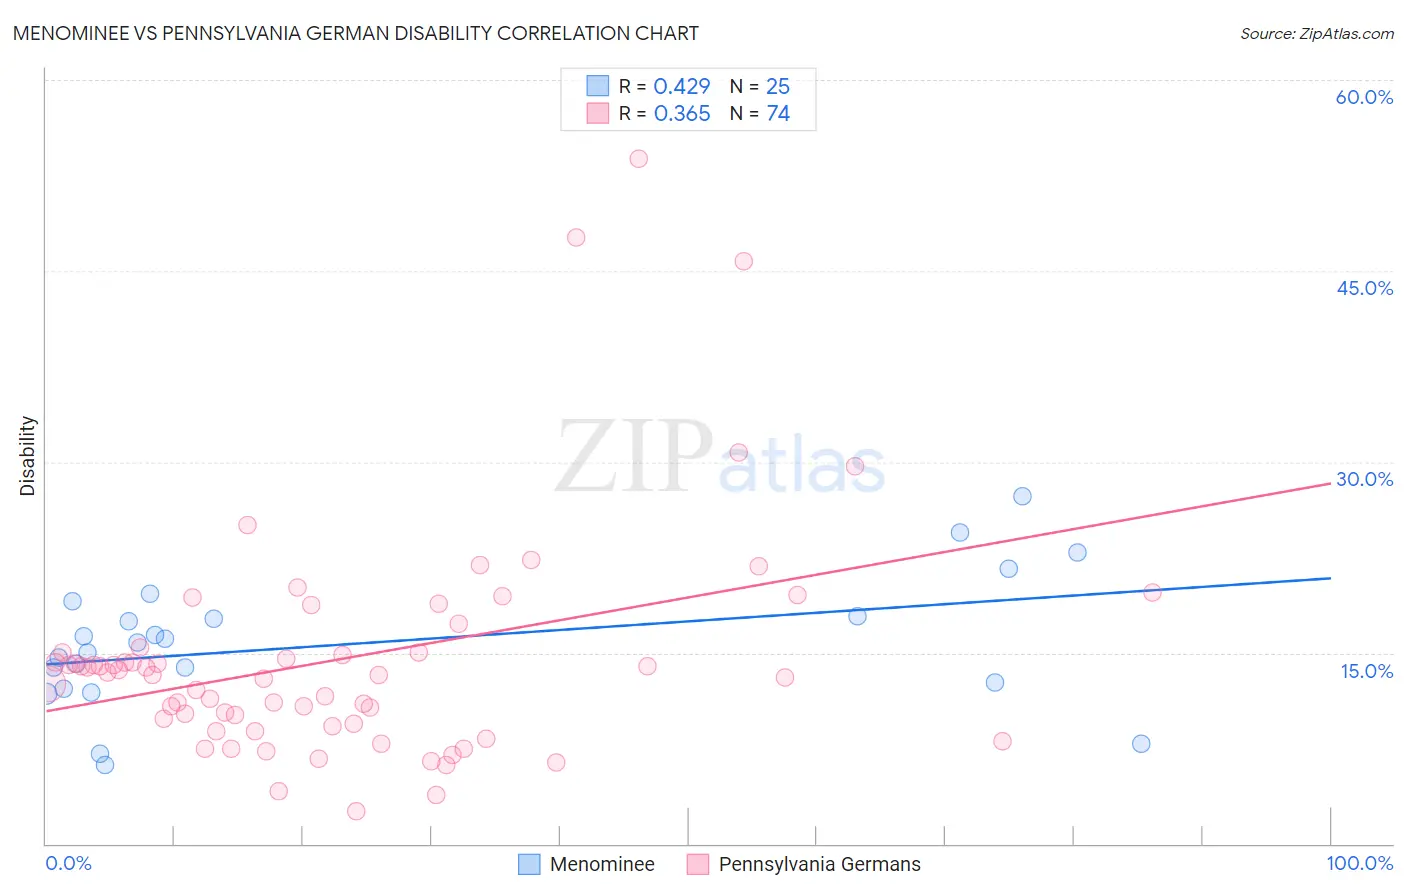
Menominee vs Pennsylvania German Disability Correlation Chart
The statistical analysis conducted on geographies consisting of 45,777,730 people shows a moderate positive correlation between the proportion of Menominee and percentage of population with a disability in the United States with a correlation coefficient (R) of 0.429 and weighted average of 13.8%. Similarly, the statistical analysis conducted on geographies consisting of 234,103,630 people shows a mild positive correlation between the proportion of Pennsylvania Germans and percentage of population with a disability in the United States with a correlation coefficient (R) of 0.365 and weighted average of 13.2%, a difference of 4.6%.
Disability Correlation Summary
| Measurement | Menominee | Pennsylvania German |
| Minimum | 6.2% | 2.6% |
| Maximum | 27.3% | 53.8% |
| Range | 21.2% | 51.3% |
| Mean | 15.8% | 14.5% |
| Median | 15.9% | 13.4% |
| Interquartile 25% (IQ1) | 12.4% | 9.5% |
| Interquartile 75% (IQ3) | 18.4% | 15.1% |
| Interquartile Range (IQR) | 6.0% | 5.6% |
| Standard Deviation (Sample) | 5.1% | 9.0% |
| Standard Deviation (Population) | 5.0% | 8.9% |
Demographics Similar to Menominee and Pennsylvania Germans by Disability
In terms of disability, the demographic groups most similar to Menominee are Iroquois (13.8%, a difference of 0.21%), Pima (13.7%, a difference of 0.58%), Immigrants from Cabo Verde (13.7%, a difference of 0.58%), Puget Sound Salish (13.7%, a difference of 0.60%), and Black/African American (13.7%, a difference of 0.61%). Similarly, the demographic groups most similar to Pennsylvania Germans are French (13.2%, a difference of 0.050%), Immigrants from Micronesia (13.2%, a difference of 0.090%), Arapaho (13.2%, a difference of 0.29%), Scotch-Irish (13.3%, a difference of 1.1%), and Yakama (13.4%, a difference of 1.5%).
| Demographics | Rating | Rank | Disability |
| French | 0.0 /100 | #299 | Tragic 13.2% |
| Pennsylvania Germans | 0.0 /100 | #300 | Tragic 13.2% |
| Immigrants | Micronesia | 0.0 /100 | #301 | Tragic 13.2% |
| Arapaho | 0.0 /100 | #302 | Tragic 13.2% |
| Scotch-Irish | 0.0 /100 | #303 | Tragic 13.3% |
| Yakama | 0.0 /100 | #304 | Tragic 13.4% |
| French Canadians | 0.0 /100 | #305 | Tragic 13.4% |
| Cape Verdeans | 0.0 /100 | #306 | Tragic 13.5% |
| Shoshone | 0.0 /100 | #307 | Tragic 13.5% |
| French American Indians | 0.0 /100 | #308 | Tragic 13.5% |
| Tlingit-Haida | 0.0 /100 | #309 | Tragic 13.5% |
| Blackfeet | 0.0 /100 | #310 | Tragic 13.6% |
| Delaware | 0.0 /100 | #311 | Tragic 13.6% |
| Spanish Americans | 0.0 /100 | #312 | Tragic 13.6% |
| Cree | 0.0 /100 | #313 | Tragic 13.7% |
| Blacks/African Americans | 0.0 /100 | #314 | Tragic 13.7% |
| Puget Sound Salish | 0.0 /100 | #315 | Tragic 13.7% |
| Pima | 0.0 /100 | #316 | Tragic 13.7% |
| Immigrants | Cabo Verde | 0.0 /100 | #317 | Tragic 13.7% |
| Menominee | 0.0 /100 | #318 | Tragic 13.8% |
| Iroquois | 0.0 /100 | #319 | Tragic 13.8% |