Menominee vs Immigrants from Latin America Disability
COMPARE
Menominee
Immigrants from Latin America
Disability
Disability Comparison
Menominee
Immigrants from Latin America
13.8%
DISABILITY
0.0/ 100
METRIC RATING
318th/ 347
METRIC RANK
11.7%
DISABILITY
54.1/ 100
METRIC RATING
168th/ 347
METRIC RANK
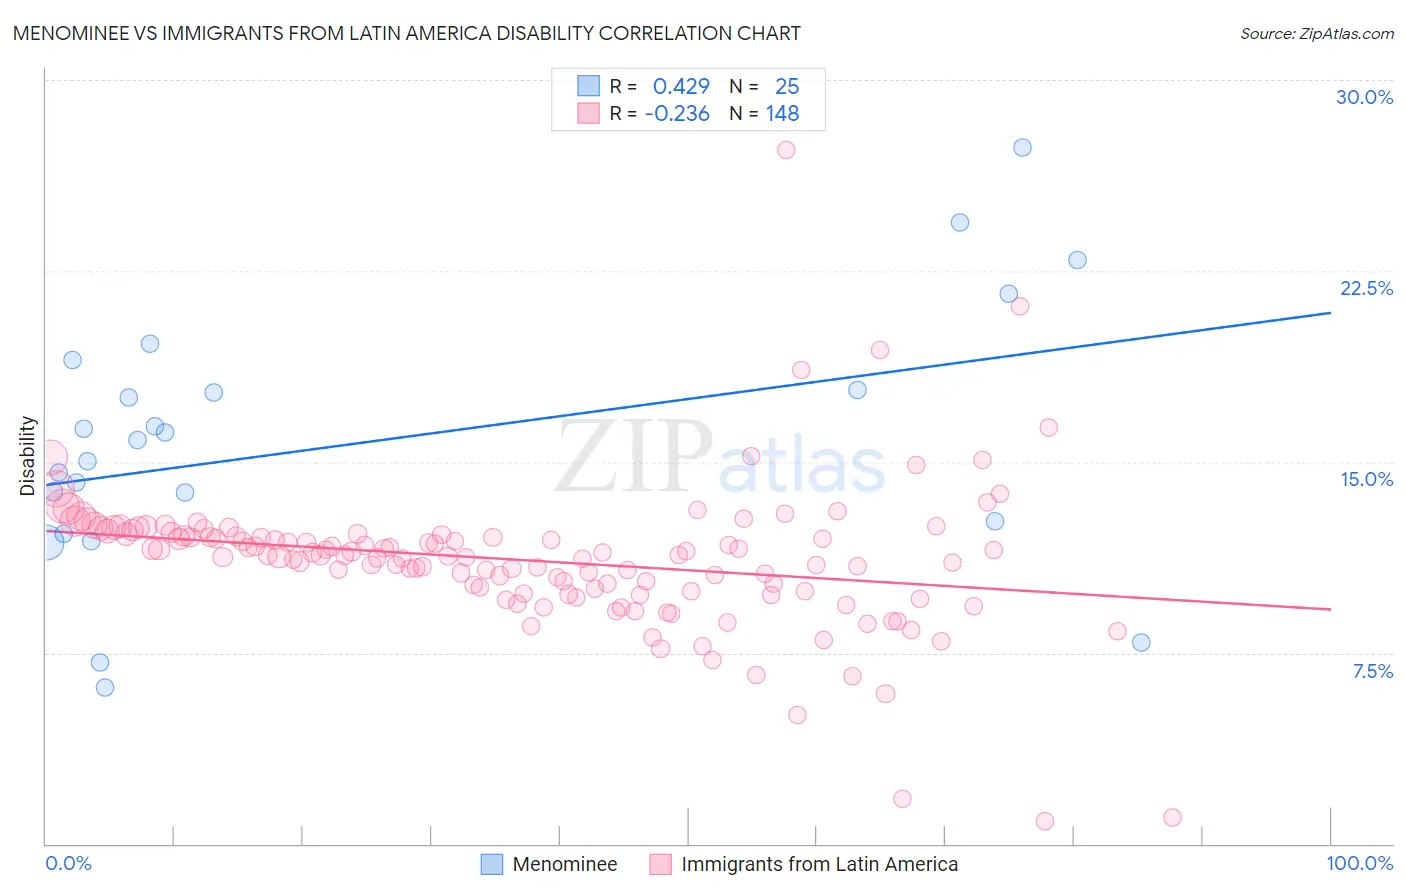
Menominee vs Immigrants from Latin America Disability Correlation Chart
The statistical analysis conducted on geographies consisting of 45,777,730 people shows a moderate positive correlation between the proportion of Menominee and percentage of population with a disability in the United States with a correlation coefficient (R) of 0.429 and weighted average of 13.8%. Similarly, the statistical analysis conducted on geographies consisting of 558,476,645 people shows a weak negative correlation between the proportion of Immigrants from Latin America and percentage of population with a disability in the United States with a correlation coefficient (R) of -0.236 and weighted average of 11.7%, a difference of 18.0%.
Disability Correlation Summary
| Measurement | Menominee | Immigrants from Latin America |
| Minimum | 6.2% | 0.89% |
| Maximum | 27.3% | 27.3% |
| Range | 21.2% | 26.4% |
| Mean | 15.8% | 11.1% |
| Median | 15.9% | 11.3% |
| Interquartile 25% (IQ1) | 12.4% | 9.9% |
| Interquartile 75% (IQ3) | 18.4% | 12.1% |
| Interquartile Range (IQR) | 6.0% | 2.2% |
| Standard Deviation (Sample) | 5.1% | 2.9% |
| Standard Deviation (Population) | 5.0% | 2.9% |
Similar Demographics by Disability
Demographics Similar to Menominee by Disability
In terms of disability, the demographic groups most similar to Menominee are Iroquois (13.8%, a difference of 0.21%), Apache (13.9%, a difference of 0.51%), Pima (13.7%, a difference of 0.58%), Immigrants from Cabo Verde (13.7%, a difference of 0.58%), and Puget Sound Salish (13.7%, a difference of 0.60%).
| Demographics | Rating | Rank | Disability |
| Delaware | 0.0 /100 | #311 | Tragic 13.6% |
| Spanish Americans | 0.0 /100 | #312 | Tragic 13.6% |
| Cree | 0.0 /100 | #313 | Tragic 13.7% |
| Blacks/African Americans | 0.0 /100 | #314 | Tragic 13.7% |
| Puget Sound Salish | 0.0 /100 | #315 | Tragic 13.7% |
| Pima | 0.0 /100 | #316 | Tragic 13.7% |
| Immigrants | Cabo Verde | 0.0 /100 | #317 | Tragic 13.7% |
| Menominee | 0.0 /100 | #318 | Tragic 13.8% |
| Iroquois | 0.0 /100 | #319 | Tragic 13.8% |
| Apache | 0.0 /100 | #320 | Tragic 13.9% |
| Paiute | 0.0 /100 | #321 | Tragic 13.9% |
| Americans | 0.0 /100 | #322 | Tragic 13.9% |
| Comanche | 0.0 /100 | #323 | Tragic 14.1% |
| Chippewa | 0.0 /100 | #324 | Tragic 14.1% |
| Natives/Alaskans | 0.0 /100 | #325 | Tragic 14.2% |
Demographics Similar to Immigrants from Latin America by Disability
In terms of disability, the demographic groups most similar to Immigrants from Latin America are Estonian (11.7%, a difference of 0.020%), Pakistani (11.7%, a difference of 0.030%), Immigrants from Austria (11.7%, a difference of 0.030%), Immigrants from Albania (11.7%, a difference of 0.060%), and Immigrants from Southern Europe (11.7%, a difference of 0.060%).
| Demographics | Rating | Rank | Disability |
| Immigrants | Cuba | 62.8 /100 | #161 | Good 11.6% |
| Immigrants | Haiti | 59.2 /100 | #162 | Average 11.7% |
| Immigrants | Trinidad and Tobago | 58.9 /100 | #163 | Average 11.7% |
| Syrians | 58.5 /100 | #164 | Average 11.7% |
| Cubans | 56.7 /100 | #165 | Average 11.7% |
| Pakistanis | 54.7 /100 | #166 | Average 11.7% |
| Estonians | 54.4 /100 | #167 | Average 11.7% |
| Immigrants | Latin America | 54.1 /100 | #168 | Average 11.7% |
| Immigrants | Austria | 53.4 /100 | #169 | Average 11.7% |
| Immigrants | Albania | 52.8 /100 | #170 | Average 11.7% |
| Immigrants | Southern Europe | 52.8 /100 | #171 | Average 11.7% |
| Trinidadians and Tobagonians | 52.7 /100 | #172 | Average 11.7% |
| Maltese | 50.6 /100 | #173 | Average 11.7% |
| Albanians | 50.0 /100 | #174 | Average 11.7% |
| Haitians | 48.6 /100 | #175 | Average 11.7% |