Menominee vs Luxembourger Disability
COMPARE
Menominee
Luxembourger
Disability
Disability Comparison
Menominee
Luxembourgers
13.8%
DISABILITY
0.0/ 100
METRIC RATING
318th/ 347
METRIC RANK
11.3%
DISABILITY
93.9/ 100
METRIC RATING
117th/ 347
METRIC RANK
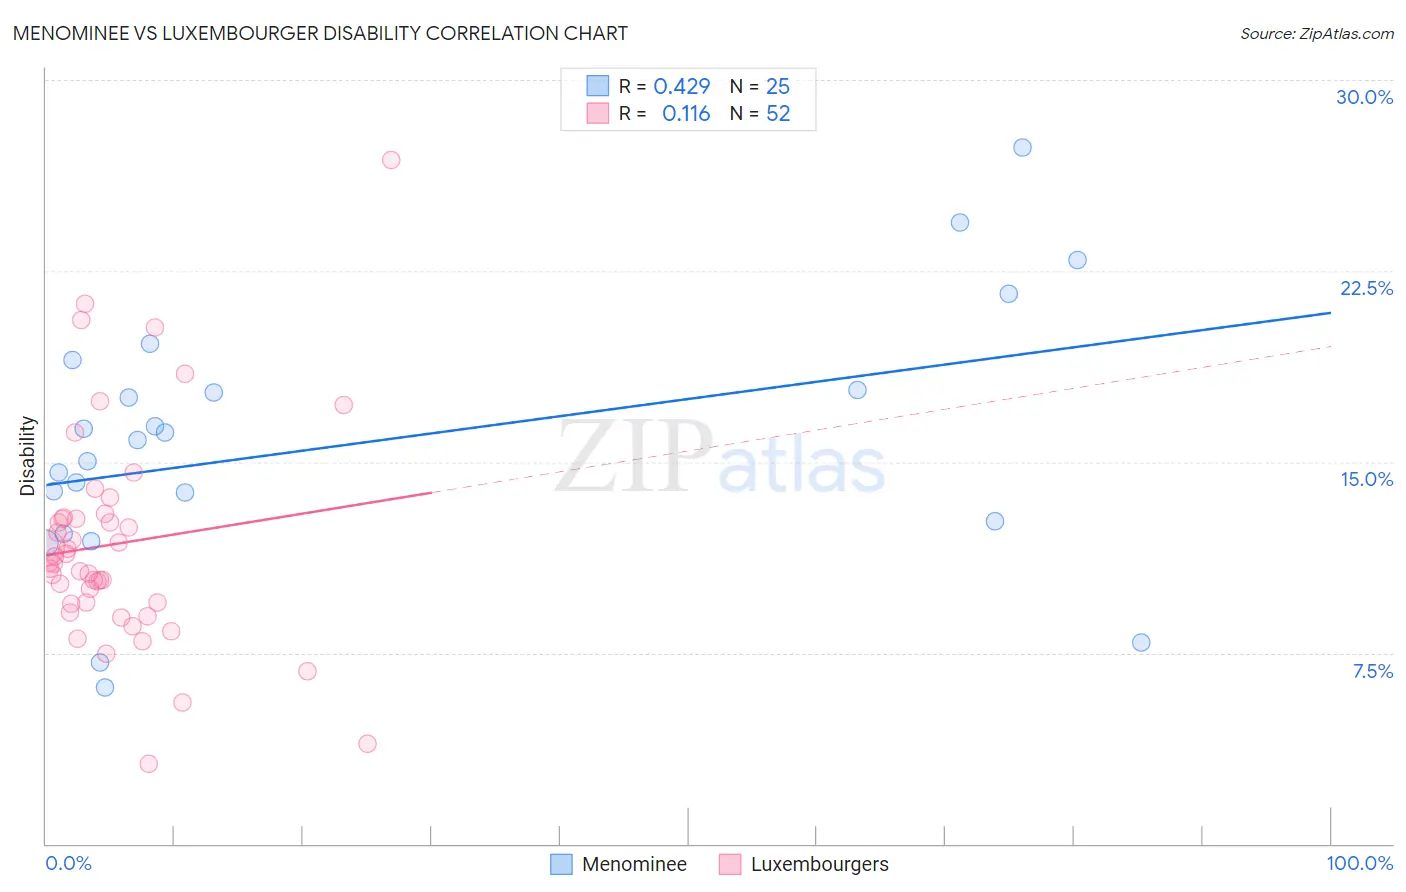
Menominee vs Luxembourger Disability Correlation Chart
The statistical analysis conducted on geographies consisting of 45,777,730 people shows a moderate positive correlation between the proportion of Menominee and percentage of population with a disability in the United States with a correlation coefficient (R) of 0.429 and weighted average of 13.8%. Similarly, the statistical analysis conducted on geographies consisting of 144,681,066 people shows a poor positive correlation between the proportion of Luxembourgers and percentage of population with a disability in the United States with a correlation coefficient (R) of 0.116 and weighted average of 11.3%, a difference of 21.5%.
Disability Correlation Summary
| Measurement | Menominee | Luxembourger |
| Minimum | 6.2% | 3.1% |
| Maximum | 27.3% | 26.9% |
| Range | 21.2% | 23.7% |
| Mean | 15.8% | 11.8% |
| Median | 15.9% | 11.0% |
| Interquartile 25% (IQ1) | 12.4% | 9.5% |
| Interquartile 75% (IQ3) | 18.4% | 12.8% |
| Interquartile Range (IQR) | 6.0% | 3.3% |
| Standard Deviation (Sample) | 5.1% | 4.3% |
| Standard Deviation (Population) | 5.0% | 4.3% |
Similar Demographics by Disability
Demographics Similar to Menominee by Disability
In terms of disability, the demographic groups most similar to Menominee are Iroquois (13.8%, a difference of 0.21%), Apache (13.9%, a difference of 0.51%), Pima (13.7%, a difference of 0.58%), Immigrants from Cabo Verde (13.7%, a difference of 0.58%), and Puget Sound Salish (13.7%, a difference of 0.60%).
| Demographics | Rating | Rank | Disability |
| Delaware | 0.0 /100 | #311 | Tragic 13.6% |
| Spanish Americans | 0.0 /100 | #312 | Tragic 13.6% |
| Cree | 0.0 /100 | #313 | Tragic 13.7% |
| Blacks/African Americans | 0.0 /100 | #314 | Tragic 13.7% |
| Puget Sound Salish | 0.0 /100 | #315 | Tragic 13.7% |
| Pima | 0.0 /100 | #316 | Tragic 13.7% |
| Immigrants | Cabo Verde | 0.0 /100 | #317 | Tragic 13.7% |
| Menominee | 0.0 /100 | #318 | Tragic 13.8% |
| Iroquois | 0.0 /100 | #319 | Tragic 13.8% |
| Apache | 0.0 /100 | #320 | Tragic 13.9% |
| Paiute | 0.0 /100 | #321 | Tragic 13.9% |
| Americans | 0.0 /100 | #322 | Tragic 13.9% |
| Comanche | 0.0 /100 | #323 | Tragic 14.1% |
| Chippewa | 0.0 /100 | #324 | Tragic 14.1% |
| Natives/Alaskans | 0.0 /100 | #325 | Tragic 14.2% |
Demographics Similar to Luxembourgers by Disability
In terms of disability, the demographic groups most similar to Luxembourgers are Korean (11.3%, a difference of 0.010%), Immigrants from Northern Europe (11.3%, a difference of 0.060%), Central American (11.4%, a difference of 0.070%), Immigrants from North Macedonia (11.4%, a difference of 0.070%), and Immigrants from Costa Rica (11.4%, a difference of 0.080%).
| Demographics | Rating | Rank | Disability |
| Immigrants | Denmark | 95.6 /100 | #110 | Exceptional 11.3% |
| Immigrants | South Eastern Asia | 95.4 /100 | #111 | Exceptional 11.3% |
| Immigrants | Uzbekistan | 94.9 /100 | #112 | Exceptional 11.3% |
| Guyanese | 94.7 /100 | #113 | Exceptional 11.3% |
| Immigrants | Syria | 94.7 /100 | #114 | Exceptional 11.3% |
| Immigrants | Philippines | 94.6 /100 | #115 | Exceptional 11.3% |
| Immigrants | Northern Europe | 94.1 /100 | #116 | Exceptional 11.3% |
| Luxembourgers | 93.9 /100 | #117 | Exceptional 11.3% |
| Koreans | 93.8 /100 | #118 | Exceptional 11.3% |
| Central Americans | 93.5 /100 | #119 | Exceptional 11.4% |
| Immigrants | North Macedonia | 93.5 /100 | #120 | Exceptional 11.4% |
| Immigrants | Costa Rica | 93.4 /100 | #121 | Exceptional 11.4% |
| Brazilians | 93.3 /100 | #122 | Exceptional 11.4% |
| South Africans | 92.3 /100 | #123 | Exceptional 11.4% |
| South American Indians | 92.2 /100 | #124 | Exceptional 11.4% |