Marshallese vs Indonesian Disability
COMPARE
Marshallese
Indonesian
Disability
Disability Comparison
Marshallese
Indonesians
13.1%
DISABILITY
0.0/ 100
METRIC RATING
293rd/ 347
METRIC RANK
12.2%
DISABILITY
1.4/ 100
METRIC RATING
247th/ 347
METRIC RANK
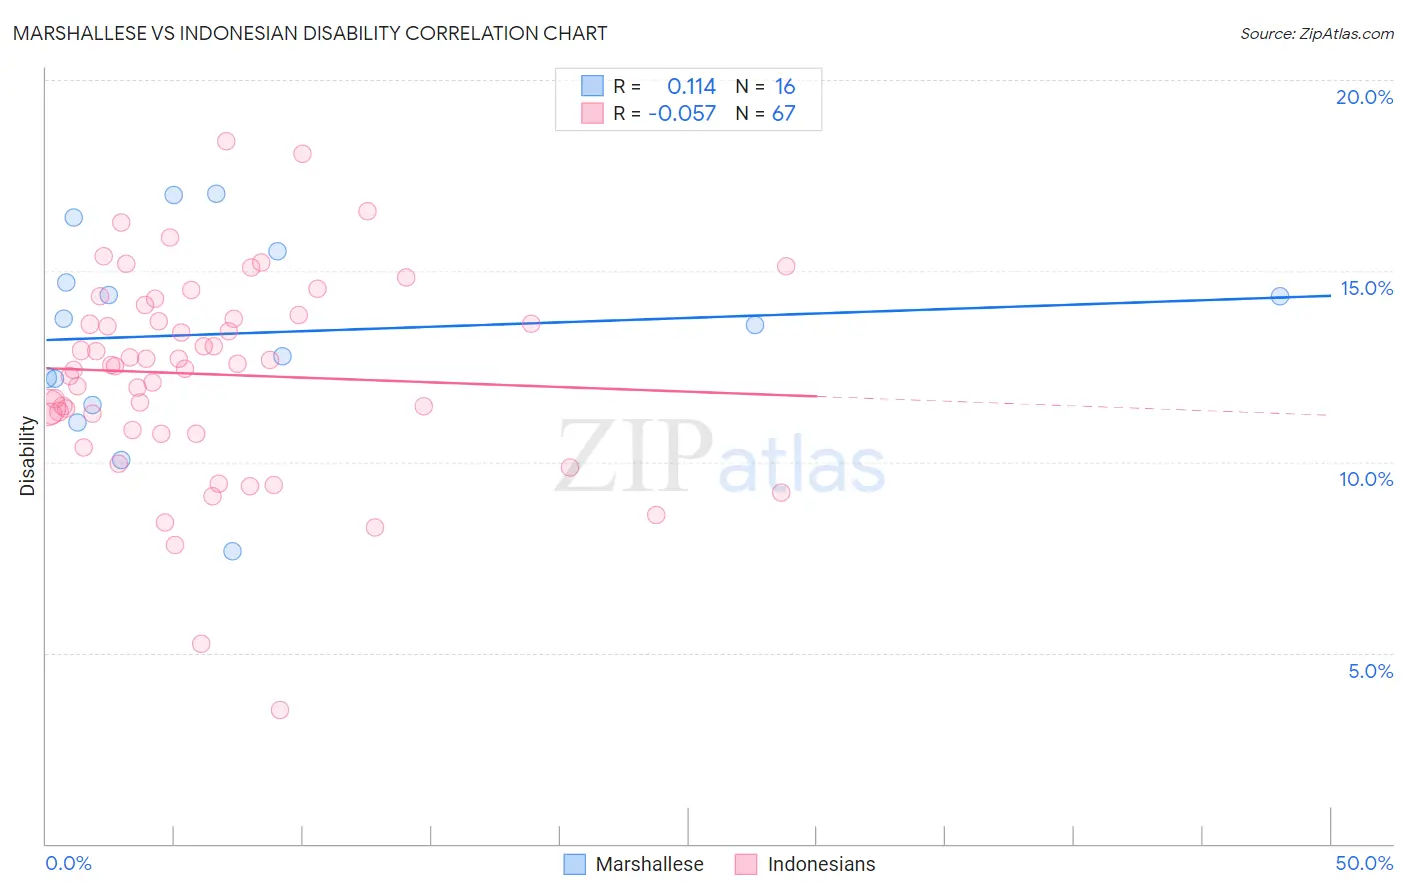
Marshallese vs Indonesian Disability Correlation Chart
The statistical analysis conducted on geographies consisting of 14,761,315 people shows a poor positive correlation between the proportion of Marshallese and percentage of population with a disability in the United States with a correlation coefficient (R) of 0.114 and weighted average of 13.1%. Similarly, the statistical analysis conducted on geographies consisting of 162,725,313 people shows a slight negative correlation between the proportion of Indonesians and percentage of population with a disability in the United States with a correlation coefficient (R) of -0.057 and weighted average of 12.2%, a difference of 6.9%.
Disability Correlation Summary
| Measurement | Marshallese | Indonesian |
| Minimum | 7.7% | 3.5% |
| Maximum | 17.0% | 18.4% |
| Range | 9.3% | 14.9% |
| Mean | 13.4% | 12.3% |
| Median | 13.7% | 12.5% |
| Interquartile 25% (IQ1) | 11.8% | 10.8% |
| Interquartile 75% (IQ3) | 15.1% | 13.9% |
| Interquartile Range (IQR) | 3.3% | 3.0% |
| Standard Deviation (Sample) | 2.6% | 2.7% |
| Standard Deviation (Population) | 2.5% | 2.6% |
Similar Demographics by Disability
Demographics Similar to Marshallese by Disability
In terms of disability, the demographic groups most similar to Marshallese are Aleut (13.1%, a difference of 0.0%), Celtic (13.1%, a difference of 0.29%), Yaqui (13.1%, a difference of 0.36%), Nonimmigrants (13.2%, a difference of 0.42%), and Central American Indian (13.2%, a difference of 0.46%).
| Demographics | Rating | Rank | Disability |
| English | 0.0 /100 | #286 | Tragic 13.0% |
| Africans | 0.0 /100 | #287 | Tragic 13.0% |
| Whites/Caucasians | 0.0 /100 | #288 | Tragic 13.0% |
| Slovaks | 0.0 /100 | #289 | Tragic 13.0% |
| Cheyenne | 0.0 /100 | #290 | Tragic 13.0% |
| Yaqui | 0.0 /100 | #291 | Tragic 13.1% |
| Aleuts | 0.0 /100 | #292 | Tragic 13.1% |
| Marshallese | 0.0 /100 | #293 | Tragic 13.1% |
| Celtics | 0.0 /100 | #294 | Tragic 13.1% |
| Immigrants | Nonimmigrants | 0.0 /100 | #295 | Tragic 13.2% |
| Central American Indians | 0.0 /100 | #296 | Tragic 13.2% |
| Hopi | 0.0 /100 | #297 | Tragic 13.2% |
| Alaska Natives | 0.0 /100 | #298 | Tragic 13.2% |
| French | 0.0 /100 | #299 | Tragic 13.2% |
| Pennsylvania Germans | 0.0 /100 | #300 | Tragic 13.2% |
Demographics Similar to Indonesians by Disability
In terms of disability, the demographic groups most similar to Indonesians are Swiss (12.2%, a difference of 0.030%), Guamanian/Chamorro (12.3%, a difference of 0.040%), Carpatho Rusyn (12.3%, a difference of 0.050%), Liberian (12.2%, a difference of 0.060%), and Subsaharan African (12.3%, a difference of 0.060%).
| Demographics | Rating | Rank | Disability |
| Hungarians | 1.7 /100 | #240 | Tragic 12.2% |
| Yugoslavians | 1.7 /100 | #241 | Tragic 12.2% |
| Poles | 1.7 /100 | #242 | Tragic 12.2% |
| British | 1.5 /100 | #243 | Tragic 12.2% |
| Basques | 1.5 /100 | #244 | Tragic 12.2% |
| Liberians | 1.5 /100 | #245 | Tragic 12.2% |
| Swiss | 1.5 /100 | #246 | Tragic 12.2% |
| Indonesians | 1.4 /100 | #247 | Tragic 12.2% |
| Guamanians/Chamorros | 1.4 /100 | #248 | Tragic 12.3% |
| Carpatho Rusyns | 1.4 /100 | #249 | Tragic 12.3% |
| Sub-Saharan Africans | 1.4 /100 | #250 | Tragic 12.3% |
| Europeans | 1.4 /100 | #251 | Tragic 12.3% |
| Bermudans | 1.1 /100 | #252 | Tragic 12.3% |
| Belgians | 0.8 /100 | #253 | Tragic 12.3% |
| German Russians | 0.8 /100 | #254 | Tragic 12.3% |