Marshallese vs Indonesian Householder Income Ages 25 - 44 years
COMPARE
Marshallese
Indonesian
Householder Income Ages 25 - 44 years
Householder Income Ages 25 - 44 years Comparison
Marshallese
Indonesians
$83,575
HOUSEHOLDER INCOME AGES 25 - 44 YEARS
0.2/ 100
METRIC RATING
274th/ 347
METRIC RANK
$79,543
HOUSEHOLDER INCOME AGES 25 - 44 YEARS
0.0/ 100
METRIC RATING
311th/ 347
METRIC RANK
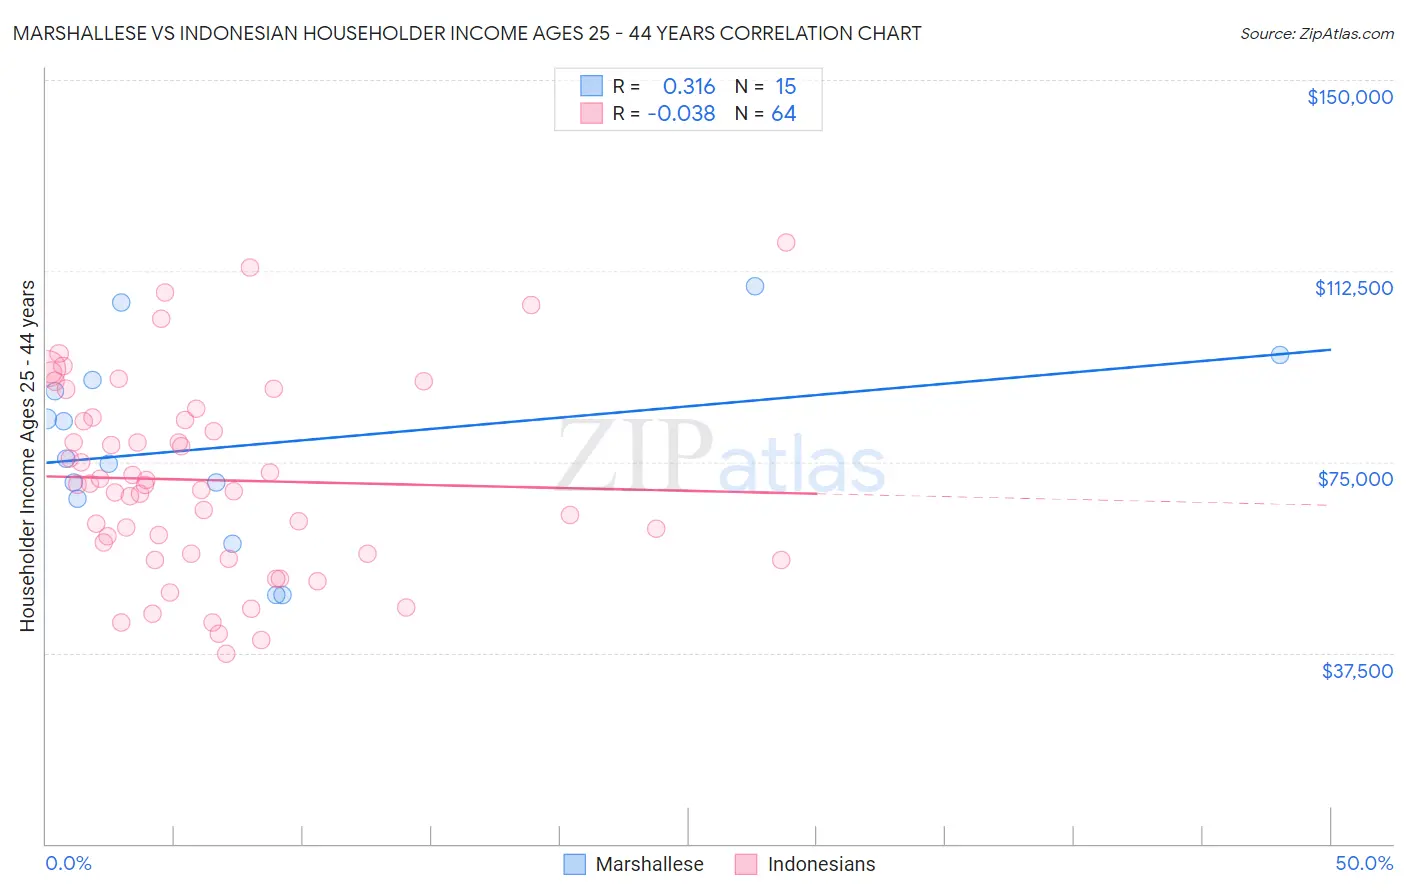
Marshallese vs Indonesian Householder Income Ages 25 - 44 years Correlation Chart
The statistical analysis conducted on geographies consisting of 14,753,881 people shows a mild positive correlation between the proportion of Marshallese and household income with householder between the ages 25 and 44 in the United States with a correlation coefficient (R) of 0.316 and weighted average of $83,575. Similarly, the statistical analysis conducted on geographies consisting of 162,548,199 people shows no correlation between the proportion of Indonesians and household income with householder between the ages 25 and 44 in the United States with a correlation coefficient (R) of -0.038 and weighted average of $79,543, a difference of 5.1%.
Householder Income Ages 25 - 44 years Correlation Summary
| Measurement | Marshallese | Indonesian |
| Minimum | $48,906 | $37,365 |
| Maximum | $109,583 | $118,125 |
| Range | $60,677 | $80,760 |
| Mean | $78,342 | $71,416 |
| Median | $75,712 | $70,496 |
| Interquartile 25% (IQ1) | $67,813 | $56,977 |
| Interquartile 75% (IQ3) | $91,124 | $83,474 |
| Interquartile Range (IQR) | $23,311 | $26,497 |
| Standard Deviation (Sample) | $18,418 | $18,886 |
| Standard Deviation (Population) | $17,794 | $18,738 |
Similar Demographics by Householder Income Ages 25 - 44 years
Demographics Similar to Marshallese by Householder Income Ages 25 - 44 years
In terms of householder income ages 25 - 44 years, the demographic groups most similar to Marshallese are Iroquois ($83,682, a difference of 0.13%), Spanish American ($83,722, a difference of 0.18%), Somali ($83,752, a difference of 0.21%), Immigrants from Jamaica ($83,298, a difference of 0.33%), and Jamaican ($83,933, a difference of 0.43%).
| Demographics | Rating | Rank | Householder Income Ages 25 - 44 years |
| Hmong | 0.3 /100 | #267 | Tragic $84,258 |
| Sub-Saharan Africans | 0.3 /100 | #268 | Tragic $84,235 |
| Spanish American Indians | 0.3 /100 | #269 | Tragic $84,085 |
| Jamaicans | 0.3 /100 | #270 | Tragic $83,933 |
| Somalis | 0.2 /100 | #271 | Tragic $83,752 |
| Spanish Americans | 0.2 /100 | #272 | Tragic $83,722 |
| Iroquois | 0.2 /100 | #273 | Tragic $83,682 |
| Marshallese | 0.2 /100 | #274 | Tragic $83,575 |
| Immigrants | Jamaica | 0.2 /100 | #275 | Tragic $83,298 |
| Immigrants | Belize | 0.2 /100 | #276 | Tragic $83,141 |
| Paiute | 0.2 /100 | #277 | Tragic $82,984 |
| Senegalese | 0.2 /100 | #278 | Tragic $82,852 |
| Pima | 0.1 /100 | #279 | Tragic $82,821 |
| Colville | 0.1 /100 | #280 | Tragic $82,604 |
| Cajuns | 0.1 /100 | #281 | Tragic $82,393 |
Demographics Similar to Indonesians by Householder Income Ages 25 - 44 years
In terms of householder income ages 25 - 44 years, the demographic groups most similar to Indonesians are Immigrants from Haiti ($79,391, a difference of 0.19%), Menominee ($79,358, a difference of 0.23%), Cheyenne ($79,152, a difference of 0.49%), Fijian ($79,956, a difference of 0.52%), and Chippewa ($80,005, a difference of 0.58%).
| Demographics | Rating | Rank | Householder Income Ages 25 - 44 years |
| Immigrants | Caribbean | 0.0 /100 | #304 | Tragic $80,326 |
| Immigrants | Dominican Republic | 0.0 /100 | #305 | Tragic $80,319 |
| Apache | 0.0 /100 | #306 | Tragic $80,260 |
| Haitians | 0.0 /100 | #307 | Tragic $80,055 |
| Immigrants | Central America | 0.0 /100 | #308 | Tragic $80,012 |
| Chippewa | 0.0 /100 | #309 | Tragic $80,005 |
| Fijians | 0.0 /100 | #310 | Tragic $79,956 |
| Indonesians | 0.0 /100 | #311 | Tragic $79,543 |
| Immigrants | Haiti | 0.0 /100 | #312 | Tragic $79,391 |
| Menominee | 0.0 /100 | #313 | Tragic $79,358 |
| Cheyenne | 0.0 /100 | #314 | Tragic $79,152 |
| Ottawa | 0.0 /100 | #315 | Tragic $79,012 |
| Africans | 0.0 /100 | #316 | Tragic $78,986 |
| U.S. Virgin Islanders | 0.0 /100 | #317 | Tragic $78,911 |
| Immigrants | Mexico | 0.0 /100 | #318 | Tragic $78,809 |