Laotian vs Indonesian Disability
COMPARE
Laotian
Indonesian
Disability
Disability Comparison
Laotians
Indonesians
11.0%
DISABILITY
99.6/ 100
METRIC RATING
66th/ 347
METRIC RANK
12.2%
DISABILITY
1.4/ 100
METRIC RATING
247th/ 347
METRIC RANK
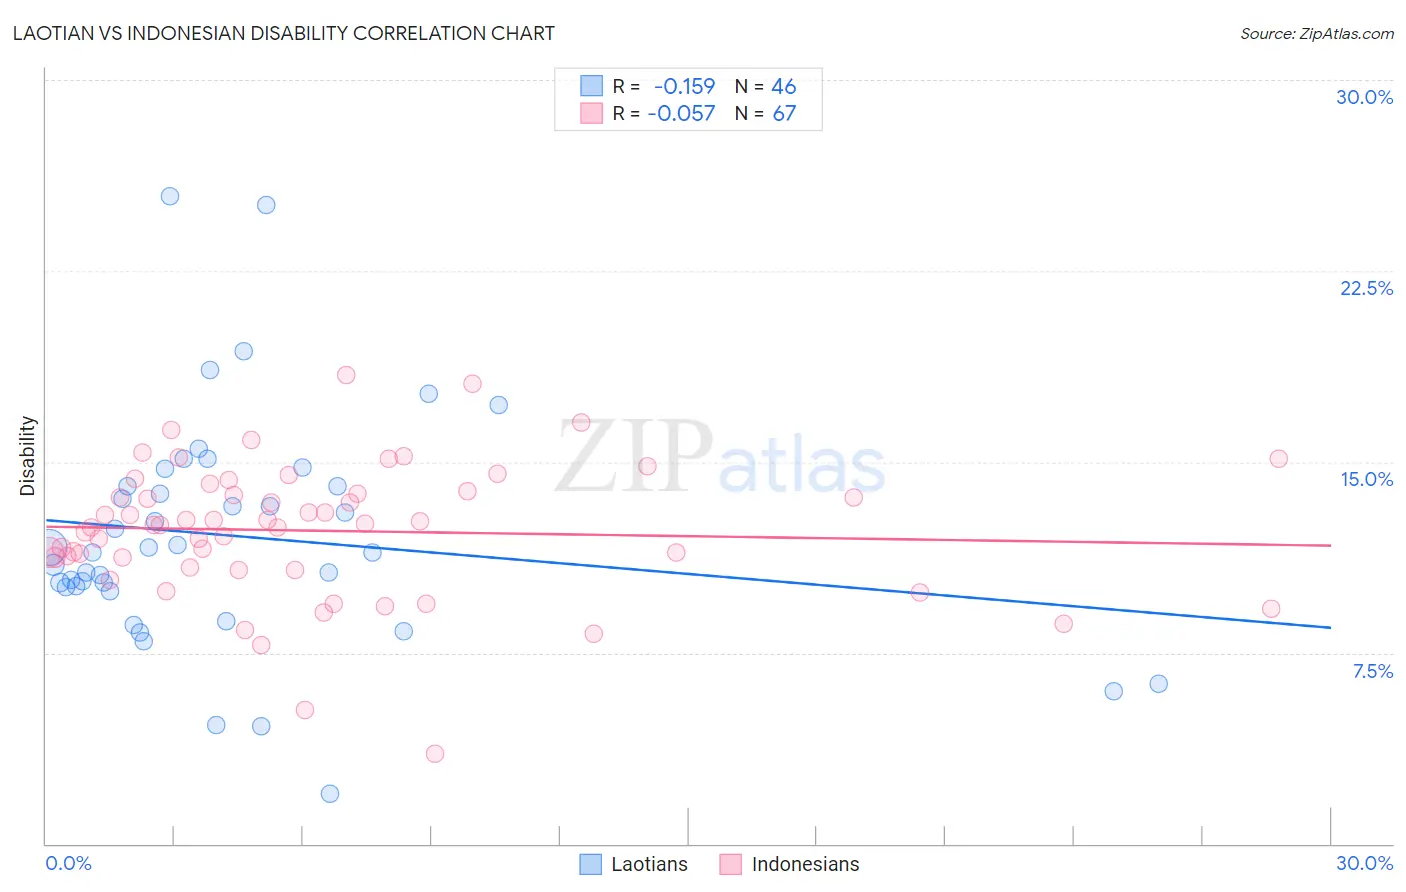
Laotian vs Indonesian Disability Correlation Chart
The statistical analysis conducted on geographies consisting of 224,855,806 people shows a poor negative correlation between the proportion of Laotians and percentage of population with a disability in the United States with a correlation coefficient (R) of -0.159 and weighted average of 11.0%. Similarly, the statistical analysis conducted on geographies consisting of 162,725,313 people shows a slight negative correlation between the proportion of Indonesians and percentage of population with a disability in the United States with a correlation coefficient (R) of -0.057 and weighted average of 12.2%, a difference of 11.6%.
Disability Correlation Summary
| Measurement | Laotian | Indonesian |
| Minimum | 2.0% | 3.5% |
| Maximum | 25.4% | 18.4% |
| Range | 23.5% | 14.9% |
| Mean | 12.1% | 12.3% |
| Median | 11.6% | 12.5% |
| Interquartile 25% (IQ1) | 10.1% | 10.8% |
| Interquartile 75% (IQ3) | 14.1% | 13.9% |
| Interquartile Range (IQR) | 4.0% | 3.0% |
| Standard Deviation (Sample) | 4.6% | 2.7% |
| Standard Deviation (Population) | 4.5% | 2.6% |
Similar Demographics by Disability
Demographics Similar to Laotians by Disability
In terms of disability, the demographic groups most similar to Laotians are Bulgarian (11.0%, a difference of 0.010%), Immigrants from Sweden (11.0%, a difference of 0.030%), Colombian (11.0%, a difference of 0.080%), Immigrants from Afghanistan (11.0%, a difference of 0.20%), and Immigrants from Eritrea (11.0%, a difference of 0.21%).
| Demographics | Rating | Rank | Disability |
| Immigrants | Colombia | 99.7 /100 | #59 | Exceptional 10.9% |
| Zimbabweans | 99.7 /100 | #60 | Exceptional 10.9% |
| Immigrants | Bulgaria | 99.7 /100 | #61 | Exceptional 10.9% |
| Immigrants | Northern Africa | 99.7 /100 | #62 | Exceptional 10.9% |
| Immigrants | Eritrea | 99.7 /100 | #63 | Exceptional 11.0% |
| Immigrants | Sweden | 99.6 /100 | #64 | Exceptional 11.0% |
| Bulgarians | 99.6 /100 | #65 | Exceptional 11.0% |
| Laotians | 99.6 /100 | #66 | Exceptional 11.0% |
| Colombians | 99.6 /100 | #67 | Exceptional 11.0% |
| Immigrants | Afghanistan | 99.6 /100 | #68 | Exceptional 11.0% |
| Sri Lankans | 99.5 /100 | #69 | Exceptional 11.0% |
| Immigrants | France | 99.4 /100 | #70 | Exceptional 11.0% |
| Immigrants | Lebanon | 99.4 /100 | #71 | Exceptional 11.0% |
| Immigrants | Chile | 99.4 /100 | #72 | Exceptional 11.0% |
| Immigrants | Bangladesh | 99.4 /100 | #73 | Exceptional 11.0% |
Demographics Similar to Indonesians by Disability
In terms of disability, the demographic groups most similar to Indonesians are Swiss (12.2%, a difference of 0.030%), Guamanian/Chamorro (12.3%, a difference of 0.040%), Carpatho Rusyn (12.3%, a difference of 0.050%), Liberian (12.2%, a difference of 0.060%), and Subsaharan African (12.3%, a difference of 0.060%).
| Demographics | Rating | Rank | Disability |
| Hungarians | 1.7 /100 | #240 | Tragic 12.2% |
| Yugoslavians | 1.7 /100 | #241 | Tragic 12.2% |
| Poles | 1.7 /100 | #242 | Tragic 12.2% |
| British | 1.5 /100 | #243 | Tragic 12.2% |
| Basques | 1.5 /100 | #244 | Tragic 12.2% |
| Liberians | 1.5 /100 | #245 | Tragic 12.2% |
| Swiss | 1.5 /100 | #246 | Tragic 12.2% |
| Indonesians | 1.4 /100 | #247 | Tragic 12.2% |
| Guamanians/Chamorros | 1.4 /100 | #248 | Tragic 12.3% |
| Carpatho Rusyns | 1.4 /100 | #249 | Tragic 12.3% |
| Sub-Saharan Africans | 1.4 /100 | #250 | Tragic 12.3% |
| Europeans | 1.4 /100 | #251 | Tragic 12.3% |
| Bermudans | 1.1 /100 | #252 | Tragic 12.3% |
| Belgians | 0.8 /100 | #253 | Tragic 12.3% |
| German Russians | 0.8 /100 | #254 | Tragic 12.3% |