Marshallese vs Immigrants from Somalia Disability
COMPARE
Marshallese
Immigrants from Somalia
Disability
Disability Comparison
Marshallese
Immigrants from Somalia
13.1%
DISABILITY
0.0/ 100
METRIC RATING
293rd/ 347
METRIC RANK
12.0%
DISABILITY
6.8/ 100
METRIC RATING
214th/ 347
METRIC RANK
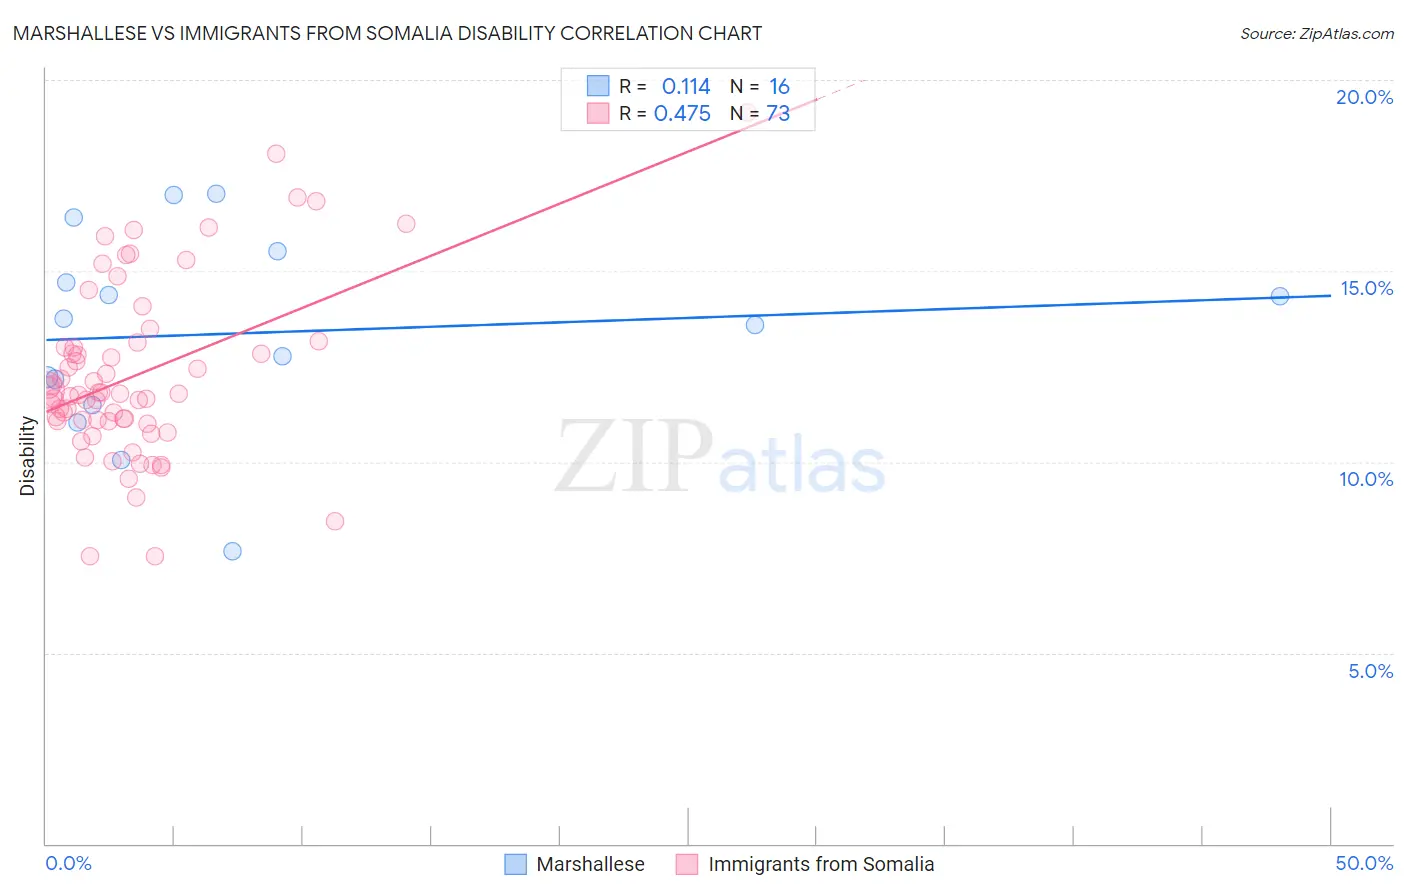
Marshallese vs Immigrants from Somalia Disability Correlation Chart
The statistical analysis conducted on geographies consisting of 14,761,315 people shows a poor positive correlation between the proportion of Marshallese and percentage of population with a disability in the United States with a correlation coefficient (R) of 0.114 and weighted average of 13.1%. Similarly, the statistical analysis conducted on geographies consisting of 92,105,363 people shows a moderate positive correlation between the proportion of Immigrants from Somalia and percentage of population with a disability in the United States with a correlation coefficient (R) of 0.475 and weighted average of 12.0%, a difference of 8.8%.
Disability Correlation Summary
| Measurement | Marshallese | Immigrants from Somalia |
| Minimum | 7.7% | 7.5% |
| Maximum | 17.0% | 19.1% |
| Range | 9.3% | 11.6% |
| Mean | 13.4% | 12.3% |
| Median | 13.7% | 11.8% |
| Interquartile 25% (IQ1) | 11.8% | 11.1% |
| Interquartile 75% (IQ3) | 15.1% | 13.1% |
| Interquartile Range (IQR) | 3.3% | 2.0% |
| Standard Deviation (Sample) | 2.6% | 2.3% |
| Standard Deviation (Population) | 2.5% | 2.3% |
Similar Demographics by Disability
Demographics Similar to Marshallese by Disability
In terms of disability, the demographic groups most similar to Marshallese are Aleut (13.1%, a difference of 0.0%), Celtic (13.1%, a difference of 0.29%), Yaqui (13.1%, a difference of 0.36%), Nonimmigrants (13.2%, a difference of 0.42%), and Central American Indian (13.2%, a difference of 0.46%).
| Demographics | Rating | Rank | Disability |
| English | 0.0 /100 | #286 | Tragic 13.0% |
| Africans | 0.0 /100 | #287 | Tragic 13.0% |
| Whites/Caucasians | 0.0 /100 | #288 | Tragic 13.0% |
| Slovaks | 0.0 /100 | #289 | Tragic 13.0% |
| Cheyenne | 0.0 /100 | #290 | Tragic 13.0% |
| Yaqui | 0.0 /100 | #291 | Tragic 13.1% |
| Aleuts | 0.0 /100 | #292 | Tragic 13.1% |
| Marshallese | 0.0 /100 | #293 | Tragic 13.1% |
| Celtics | 0.0 /100 | #294 | Tragic 13.1% |
| Immigrants | Nonimmigrants | 0.0 /100 | #295 | Tragic 13.2% |
| Central American Indians | 0.0 /100 | #296 | Tragic 13.2% |
| Hopi | 0.0 /100 | #297 | Tragic 13.2% |
| Alaska Natives | 0.0 /100 | #298 | Tragic 13.2% |
| French | 0.0 /100 | #299 | Tragic 13.2% |
| Pennsylvania Germans | 0.0 /100 | #300 | Tragic 13.2% |
Demographics Similar to Immigrants from Somalia by Disability
In terms of disability, the demographic groups most similar to Immigrants from Somalia are Immigrants from Iraq (12.0%, a difference of 0.050%), Austrian (12.0%, a difference of 0.060%), Immigrants from Cambodia (12.0%, a difference of 0.080%), Immigrants from Canada (12.1%, a difference of 0.13%), and Czech (12.0%, a difference of 0.16%).
| Demographics | Rating | Rank | Disability |
| Immigrants | Thailand | 9.3 /100 | #207 | Tragic 12.0% |
| Immigrants | Caribbean | 9.1 /100 | #208 | Tragic 12.0% |
| Danes | 8.7 /100 | #209 | Tragic 12.0% |
| Czechs | 7.9 /100 | #210 | Tragic 12.0% |
| Immigrants | Cambodia | 7.3 /100 | #211 | Tragic 12.0% |
| Austrians | 7.2 /100 | #212 | Tragic 12.0% |
| Immigrants | Iraq | 7.1 /100 | #213 | Tragic 12.0% |
| Immigrants | Somalia | 6.8 /100 | #214 | Tragic 12.0% |
| Immigrants | Canada | 6.1 /100 | #215 | Tragic 12.1% |
| Panamanians | 5.4 /100 | #216 | Tragic 12.1% |
| Immigrants | North America | 5.3 /100 | #217 | Tragic 12.1% |
| Immigrants | Jamaica | 5.0 /100 | #218 | Tragic 12.1% |
| Croatians | 4.9 /100 | #219 | Tragic 12.1% |
| Immigrants | Bahamas | 4.7 /100 | #220 | Tragic 12.1% |
| Northern Europeans | 4.2 /100 | #221 | Tragic 12.1% |