Marshallese vs Immigrants from Venezuela Disability
COMPARE
Marshallese
Immigrants from Venezuela
Disability
Disability Comparison
Marshallese
Immigrants from Venezuela
13.1%
DISABILITY
0.0/ 100
METRIC RATING
293rd/ 347
METRIC RANK
10.4%
DISABILITY
100.0/ 100
METRIC RATING
20th/ 347
METRIC RANK
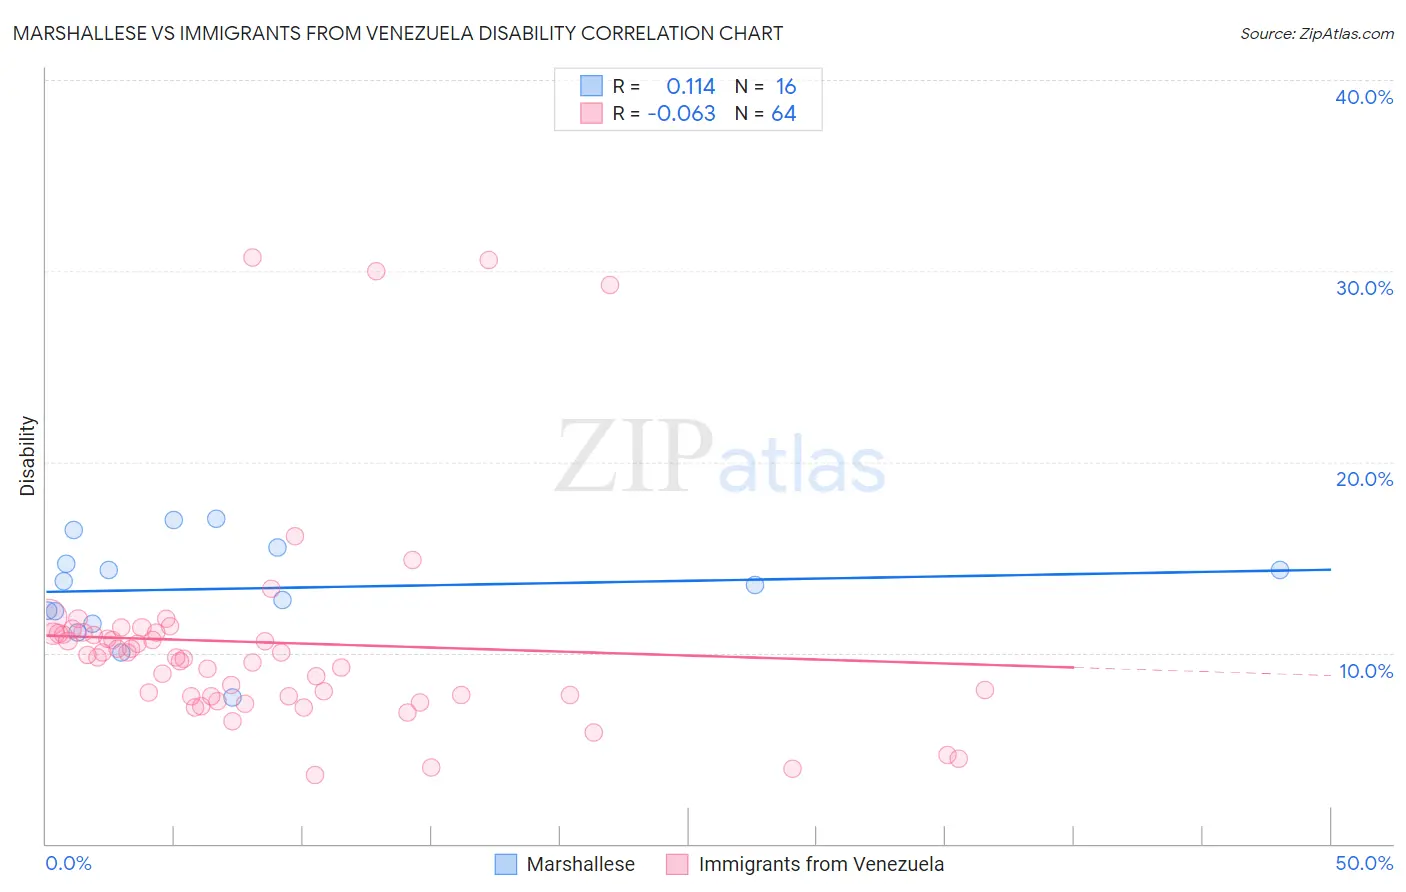
Marshallese vs Immigrants from Venezuela Disability Correlation Chart
The statistical analysis conducted on geographies consisting of 14,761,315 people shows a poor positive correlation between the proportion of Marshallese and percentage of population with a disability in the United States with a correlation coefficient (R) of 0.114 and weighted average of 13.1%. Similarly, the statistical analysis conducted on geographies consisting of 287,858,715 people shows a slight negative correlation between the proportion of Immigrants from Venezuela and percentage of population with a disability in the United States with a correlation coefficient (R) of -0.063 and weighted average of 10.4%, a difference of 25.5%.
Disability Correlation Summary
| Measurement | Marshallese | Immigrants from Venezuela |
| Minimum | 7.7% | 3.6% |
| Maximum | 17.0% | 30.7% |
| Range | 9.3% | 27.2% |
| Mean | 13.4% | 10.5% |
| Median | 13.7% | 9.8% |
| Interquartile 25% (IQ1) | 11.8% | 7.7% |
| Interquartile 75% (IQ3) | 15.1% | 11.0% |
| Interquartile Range (IQR) | 3.3% | 3.3% |
| Standard Deviation (Sample) | 2.6% | 5.6% |
| Standard Deviation (Population) | 2.5% | 5.6% |
Similar Demographics by Disability
Demographics Similar to Marshallese by Disability
In terms of disability, the demographic groups most similar to Marshallese are Aleut (13.1%, a difference of 0.0%), Celtic (13.1%, a difference of 0.29%), Yaqui (13.1%, a difference of 0.36%), Nonimmigrants (13.2%, a difference of 0.42%), and Central American Indian (13.2%, a difference of 0.46%).
| Demographics | Rating | Rank | Disability |
| English | 0.0 /100 | #286 | Tragic 13.0% |
| Africans | 0.0 /100 | #287 | Tragic 13.0% |
| Whites/Caucasians | 0.0 /100 | #288 | Tragic 13.0% |
| Slovaks | 0.0 /100 | #289 | Tragic 13.0% |
| Cheyenne | 0.0 /100 | #290 | Tragic 13.0% |
| Yaqui | 0.0 /100 | #291 | Tragic 13.1% |
| Aleuts | 0.0 /100 | #292 | Tragic 13.1% |
| Marshallese | 0.0 /100 | #293 | Tragic 13.1% |
| Celtics | 0.0 /100 | #294 | Tragic 13.1% |
| Immigrants | Nonimmigrants | 0.0 /100 | #295 | Tragic 13.2% |
| Central American Indians | 0.0 /100 | #296 | Tragic 13.2% |
| Hopi | 0.0 /100 | #297 | Tragic 13.2% |
| Alaska Natives | 0.0 /100 | #298 | Tragic 13.2% |
| French | 0.0 /100 | #299 | Tragic 13.2% |
| Pennsylvania Germans | 0.0 /100 | #300 | Tragic 13.2% |
Demographics Similar to Immigrants from Venezuela by Disability
In terms of disability, the demographic groups most similar to Immigrants from Venezuela are Asian (10.4%, a difference of 0.030%), Immigrants from Sri Lanka (10.5%, a difference of 0.13%), Immigrants from Pakistan (10.4%, a difference of 0.69%), Burmese (10.4%, a difference of 0.70%), and Immigrants from Asia (10.5%, a difference of 0.82%).
| Demographics | Rating | Rank | Disability |
| Immigrants | Eastern Asia | 100.0 /100 | #13 | Exceptional 10.2% |
| Immigrants | Korea | 100.0 /100 | #14 | Exceptional 10.2% |
| Okinawans | 100.0 /100 | #15 | Exceptional 10.3% |
| Indians (Asian) | 100.0 /100 | #16 | Exceptional 10.3% |
| Immigrants | Iran | 100.0 /100 | #17 | Exceptional 10.3% |
| Burmese | 100.0 /100 | #18 | Exceptional 10.4% |
| Immigrants | Pakistan | 100.0 /100 | #19 | Exceptional 10.4% |
| Immigrants | Venezuela | 100.0 /100 | #20 | Exceptional 10.4% |
| Asians | 100.0 /100 | #21 | Exceptional 10.4% |
| Immigrants | Sri Lanka | 100.0 /100 | #22 | Exceptional 10.5% |
| Immigrants | Asia | 100.0 /100 | #23 | Exceptional 10.5% |
| Venezuelans | 100.0 /100 | #24 | Exceptional 10.5% |
| Immigrants | Malaysia | 100.0 /100 | #25 | Exceptional 10.6% |
| Argentineans | 100.0 /100 | #26 | Exceptional 10.6% |
| Cypriots | 100.0 /100 | #27 | Exceptional 10.6% |