Marshallese vs Jordanian Disability
COMPARE
Marshallese
Jordanian
Disability
Disability Comparison
Marshallese
Jordanians
13.1%
DISABILITY
0.0/ 100
METRIC RATING
293rd/ 347
METRIC RANK
10.9%
DISABILITY
99.8/ 100
METRIC RATING
54th/ 347
METRIC RANK
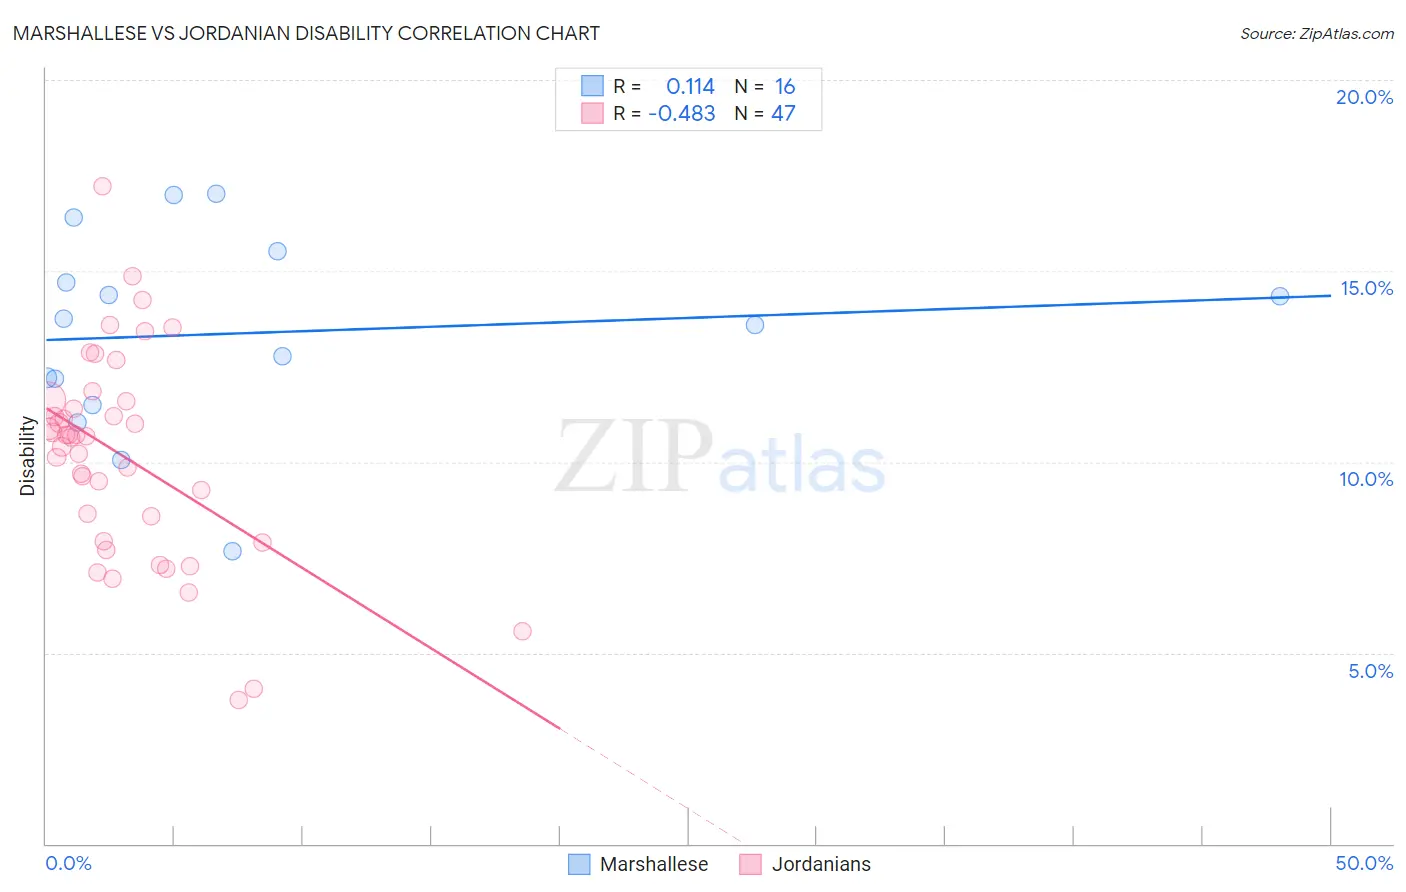
Marshallese vs Jordanian Disability Correlation Chart
The statistical analysis conducted on geographies consisting of 14,761,315 people shows a poor positive correlation between the proportion of Marshallese and percentage of population with a disability in the United States with a correlation coefficient (R) of 0.114 and weighted average of 13.1%. Similarly, the statistical analysis conducted on geographies consisting of 166,416,962 people shows a moderate negative correlation between the proportion of Jordanians and percentage of population with a disability in the United States with a correlation coefficient (R) of -0.483 and weighted average of 10.9%, a difference of 20.5%.
Disability Correlation Summary
| Measurement | Marshallese | Jordanian |
| Minimum | 7.7% | 3.7% |
| Maximum | 17.0% | 17.2% |
| Range | 9.3% | 13.5% |
| Mean | 13.4% | 10.2% |
| Median | 13.7% | 10.7% |
| Interquartile 25% (IQ1) | 11.8% | 7.9% |
| Interquartile 75% (IQ3) | 15.1% | 11.6% |
| Interquartile Range (IQR) | 3.3% | 3.7% |
| Standard Deviation (Sample) | 2.6% | 2.7% |
| Standard Deviation (Population) | 2.5% | 2.7% |
Similar Demographics by Disability
Demographics Similar to Marshallese by Disability
In terms of disability, the demographic groups most similar to Marshallese are Aleut (13.1%, a difference of 0.0%), Celtic (13.1%, a difference of 0.29%), Yaqui (13.1%, a difference of 0.36%), Nonimmigrants (13.2%, a difference of 0.42%), and Central American Indian (13.2%, a difference of 0.46%).
| Demographics | Rating | Rank | Disability |
| English | 0.0 /100 | #286 | Tragic 13.0% |
| Africans | 0.0 /100 | #287 | Tragic 13.0% |
| Whites/Caucasians | 0.0 /100 | #288 | Tragic 13.0% |
| Slovaks | 0.0 /100 | #289 | Tragic 13.0% |
| Cheyenne | 0.0 /100 | #290 | Tragic 13.0% |
| Yaqui | 0.0 /100 | #291 | Tragic 13.1% |
| Aleuts | 0.0 /100 | #292 | Tragic 13.1% |
| Marshallese | 0.0 /100 | #293 | Tragic 13.1% |
| Celtics | 0.0 /100 | #294 | Tragic 13.1% |
| Immigrants | Nonimmigrants | 0.0 /100 | #295 | Tragic 13.2% |
| Central American Indians | 0.0 /100 | #296 | Tragic 13.2% |
| Hopi | 0.0 /100 | #297 | Tragic 13.2% |
| Alaska Natives | 0.0 /100 | #298 | Tragic 13.2% |
| French | 0.0 /100 | #299 | Tragic 13.2% |
| Pennsylvania Germans | 0.0 /100 | #300 | Tragic 13.2% |
Demographics Similar to Jordanians by Disability
In terms of disability, the demographic groups most similar to Jordanians are Immigrants from Spain (10.9%, a difference of 0.0%), South American (10.9%, a difference of 0.020%), Peruvian (10.9%, a difference of 0.080%), Vietnamese (10.9%, a difference of 0.090%), and Immigrants from Saudi Arabia (10.9%, a difference of 0.090%).
| Demographics | Rating | Rank | Disability |
| Taiwanese | 99.9 /100 | #47 | Exceptional 10.8% |
| Soviet Union | 99.9 /100 | #48 | Exceptional 10.9% |
| Vietnamese | 99.9 /100 | #49 | Exceptional 10.9% |
| Immigrants | Saudi Arabia | 99.9 /100 | #50 | Exceptional 10.9% |
| Peruvians | 99.8 /100 | #51 | Exceptional 10.9% |
| South Americans | 99.8 /100 | #52 | Exceptional 10.9% |
| Immigrants | Spain | 99.8 /100 | #53 | Exceptional 10.9% |
| Jordanians | 99.8 /100 | #54 | Exceptional 10.9% |
| Immigrants | El Salvador | 99.8 /100 | #55 | Exceptional 10.9% |
| Immigrants | Lithuania | 99.8 /100 | #56 | Exceptional 10.9% |
| Salvadorans | 99.8 /100 | #57 | Exceptional 10.9% |
| Immigrants | South America | 99.8 /100 | #58 | Exceptional 10.9% |
| Immigrants | Colombia | 99.7 /100 | #59 | Exceptional 10.9% |
| Zimbabweans | 99.7 /100 | #60 | Exceptional 10.9% |
| Immigrants | Bulgaria | 99.7 /100 | #61 | Exceptional 10.9% |