Marshallese vs Indonesian Family Households with Children
COMPARE
Marshallese
Indonesian
Family Households with Children
Family Households with Children Comparison
Marshallese
Indonesians
26.2%
FAMILY HOUSEHOLDS WITH CHILDREN
0.0/ 100
METRIC RATING
310th/ 347
METRIC RANK
28.1%
FAMILY HOUSEHOLDS WITH CHILDREN
98.8/ 100
METRIC RATING
100th/ 347
METRIC RANK
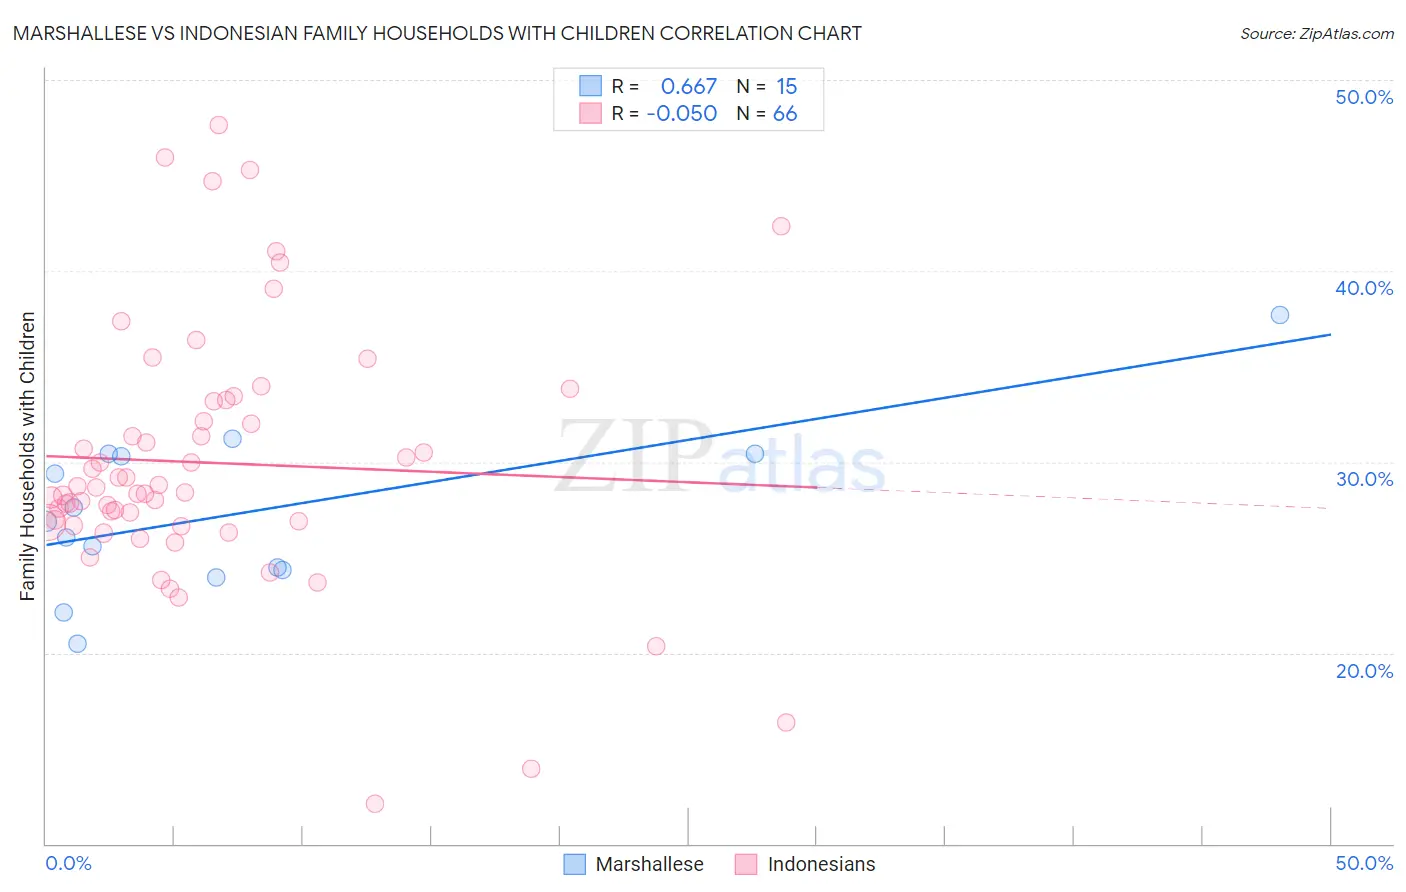
Marshallese vs Indonesian Family Households with Children Correlation Chart
The statistical analysis conducted on geographies consisting of 14,760,991 people shows a significant positive correlation between the proportion of Marshallese and percentage of family households with children in the United States with a correlation coefficient (R) of 0.667 and weighted average of 26.2%. Similarly, the statistical analysis conducted on geographies consisting of 162,603,576 people shows a slight negative correlation between the proportion of Indonesians and percentage of family households with children in the United States with a correlation coefficient (R) of -0.050 and weighted average of 28.1%, a difference of 7.1%.
Family Households with Children Correlation Summary
| Measurement | Marshallese | Indonesian |
| Minimum | 20.5% | 12.1% |
| Maximum | 37.7% | 47.7% |
| Range | 17.2% | 35.6% |
| Mean | 27.4% | 29.9% |
| Median | 26.9% | 28.5% |
| Interquartile 25% (IQ1) | 24.3% | 26.8% |
| Interquartile 75% (IQ3) | 30.4% | 33.2% |
| Interquartile Range (IQR) | 6.1% | 6.4% |
| Standard Deviation (Sample) | 4.3% | 6.8% |
| Standard Deviation (Population) | 4.2% | 6.7% |
Similar Demographics by Family Households with Children
Demographics Similar to Marshallese by Family Households with Children
In terms of family households with children, the demographic groups most similar to Marshallese are Immigrants from Somalia (26.3%, a difference of 0.050%), Colville (26.2%, a difference of 0.050%), Immigrants from Czechoslovakia (26.2%, a difference of 0.12%), Lumbee (26.3%, a difference of 0.16%), and West Indian (26.3%, a difference of 0.18%).
| Demographics | Rating | Rank | Family Households with Children |
| Immigrants | Guyana | 0.1 /100 | #303 | Tragic 26.3% |
| Immigrants | Bahamas | 0.1 /100 | #304 | Tragic 26.3% |
| Guyanese | 0.1 /100 | #305 | Tragic 26.3% |
| Bermudans | 0.1 /100 | #306 | Tragic 26.3% |
| West Indians | 0.0 /100 | #307 | Tragic 26.3% |
| Lumbee | 0.0 /100 | #308 | Tragic 26.3% |
| Immigrants | Somalia | 0.0 /100 | #309 | Tragic 26.3% |
| Marshallese | 0.0 /100 | #310 | Tragic 26.2% |
| Colville | 0.0 /100 | #311 | Tragic 26.2% |
| Immigrants | Czechoslovakia | 0.0 /100 | #312 | Tragic 26.2% |
| Cree | 0.0 /100 | #313 | Tragic 26.2% |
| French Canadians | 0.0 /100 | #314 | Tragic 26.1% |
| Immigrants | Norway | 0.0 /100 | #315 | Tragic 26.1% |
| Estonians | 0.0 /100 | #316 | Tragic 26.1% |
| Ottawa | 0.0 /100 | #317 | Tragic 26.1% |
Demographics Similar to Indonesians by Family Households with Children
In terms of family households with children, the demographic groups most similar to Indonesians are Immigrants from the Azores (28.1%, a difference of 0.0%), Immigrants from Kenya (28.1%, a difference of 0.010%), Immigrants from Oceania (28.1%, a difference of 0.020%), Assyrian/Chaldean/Syriac (28.1%, a difference of 0.050%), and Chilean (28.1%, a difference of 0.060%).
| Demographics | Rating | Rank | Family Households with Children |
| Panamanians | 99.3 /100 | #93 | Exceptional 28.2% |
| Immigrants | Colombia | 99.2 /100 | #94 | Exceptional 28.2% |
| Immigrants | Nicaragua | 99.1 /100 | #95 | Exceptional 28.2% |
| Ute | 99.1 /100 | #96 | Exceptional 28.2% |
| Chileans | 98.9 /100 | #97 | Exceptional 28.1% |
| Immigrants | Kenya | 98.9 /100 | #98 | Exceptional 28.1% |
| Immigrants | Azores | 98.8 /100 | #99 | Exceptional 28.1% |
| Indonesians | 98.8 /100 | #100 | Exceptional 28.1% |
| Immigrants | Oceania | 98.8 /100 | #101 | Exceptional 28.1% |
| Assyrians/Chaldeans/Syriacs | 98.7 /100 | #102 | Exceptional 28.1% |
| Palestinians | 98.5 /100 | #103 | Exceptional 28.1% |
| Sioux | 98.3 /100 | #104 | Exceptional 28.1% |
| Choctaw | 98.3 /100 | #105 | Exceptional 28.1% |
| Immigrants | South America | 98.0 /100 | #106 | Exceptional 28.0% |
| Immigrants | Uganda | 97.7 /100 | #107 | Exceptional 28.0% |