Marshallese vs Immigrants from Vietnam Hearing Disability
COMPARE
Marshallese
Immigrants from Vietnam
Hearing Disability
Hearing Disability Comparison
Marshallese
Immigrants from Vietnam
3.8%
HEARING DISABILITY
0.0/ 100
METRIC RATING
306th/ 347
METRIC RANK
2.9%
HEARING DISABILITY
86.5/ 100
METRIC RATING
130th/ 347
METRIC RANK
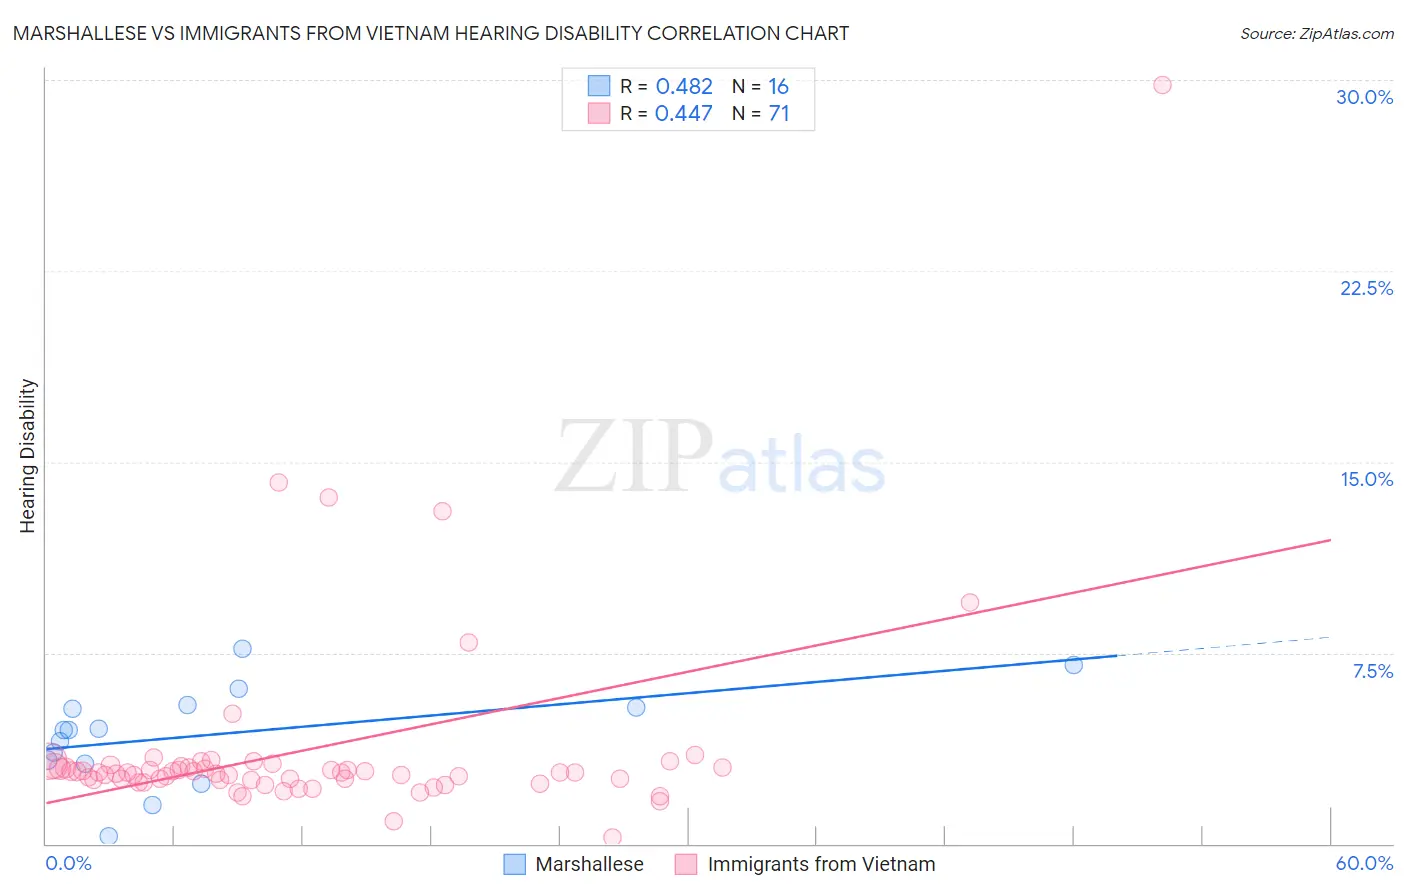
Marshallese vs Immigrants from Vietnam Hearing Disability Correlation Chart
The statistical analysis conducted on geographies consisting of 14,761,315 people shows a moderate positive correlation between the proportion of Marshallese and percentage of population with hearing disability in the United States with a correlation coefficient (R) of 0.482 and weighted average of 3.8%. Similarly, the statistical analysis conducted on geographies consisting of 404,662,958 people shows a moderate positive correlation between the proportion of Immigrants from Vietnam and percentage of population with hearing disability in the United States with a correlation coefficient (R) of 0.447 and weighted average of 2.9%, a difference of 32.9%.
Hearing Disability Correlation Summary
| Measurement | Marshallese | Immigrants from Vietnam |
| Minimum | 0.29% | 0.23% |
| Maximum | 7.7% | 29.8% |
| Range | 7.4% | 29.6% |
| Mean | 4.3% | 3.7% |
| Median | 4.5% | 2.8% |
| Interquartile 25% (IQ1) | 3.2% | 2.5% |
| Interquartile 75% (IQ3) | 5.4% | 3.0% |
| Interquartile Range (IQR) | 2.2% | 0.53% |
| Standard Deviation (Sample) | 1.9% | 4.0% |
| Standard Deviation (Population) | 1.9% | 4.0% |
Similar Demographics by Hearing Disability
Demographics Similar to Marshallese by Hearing Disability
In terms of hearing disability, the demographic groups most similar to Marshallese are French Canadian (3.8%, a difference of 0.12%), Ottawa (3.8%, a difference of 0.56%), Scotch-Irish (3.8%, a difference of 0.64%), English (3.8%, a difference of 0.86%), and Cree (3.8%, a difference of 0.95%).
| Demographics | Rating | Rank | Hearing Disability |
| Germans | 0.0 /100 | #299 | Tragic 3.7% |
| Scottish | 0.0 /100 | #300 | Tragic 3.7% |
| Pennsylvania Germans | 0.0 /100 | #301 | Tragic 3.7% |
| Dutch | 0.0 /100 | #302 | Tragic 3.7% |
| Menominee | 0.0 /100 | #303 | Tragic 3.7% |
| French | 0.0 /100 | #304 | Tragic 3.8% |
| English | 0.0 /100 | #305 | Tragic 3.8% |
| Marshallese | 0.0 /100 | #306 | Tragic 3.8% |
| French Canadians | 0.0 /100 | #307 | Tragic 3.8% |
| Ottawa | 0.0 /100 | #308 | Tragic 3.8% |
| Scotch-Irish | 0.0 /100 | #309 | Tragic 3.8% |
| Cree | 0.0 /100 | #310 | Tragic 3.8% |
| Americans | 0.0 /100 | #311 | Tragic 3.9% |
| Cajuns | 0.0 /100 | #312 | Tragic 3.9% |
| Hopi | 0.0 /100 | #313 | Tragic 3.9% |
Demographics Similar to Immigrants from Vietnam by Hearing Disability
In terms of hearing disability, the demographic groups most similar to Immigrants from Vietnam are Immigrants from Uganda (2.9%, a difference of 0.020%), South American Indian (2.9%, a difference of 0.070%), Immigrants from Western Asia (2.9%, a difference of 0.070%), Immigrants from Kenya (2.9%, a difference of 0.090%), and Chilean (2.9%, a difference of 0.14%).
| Demographics | Rating | Rank | Hearing Disability |
| Immigrants | Zaire | 88.6 /100 | #123 | Excellent 2.9% |
| Bahamians | 88.6 /100 | #124 | Excellent 2.9% |
| Immigrants | Albania | 88.5 /100 | #125 | Excellent 2.9% |
| Immigrants | Sudan | 87.8 /100 | #126 | Excellent 2.9% |
| South American Indians | 86.9 /100 | #127 | Excellent 2.9% |
| Immigrants | Western Asia | 86.9 /100 | #128 | Excellent 2.9% |
| Immigrants | Uganda | 86.6 /100 | #129 | Excellent 2.9% |
| Immigrants | Vietnam | 86.5 /100 | #130 | Excellent 2.9% |
| Immigrants | Kenya | 86.1 /100 | #131 | Excellent 2.9% |
| Chileans | 85.8 /100 | #132 | Excellent 2.9% |
| Immigrants | Syria | 85.8 /100 | #133 | Excellent 2.9% |
| Ugandans | 85.5 /100 | #134 | Excellent 2.9% |
| Soviet Union | 84.8 /100 | #135 | Excellent 2.9% |
| Immigrants | Brazil | 84.6 /100 | #136 | Excellent 2.9% |
| Sri Lankans | 84.1 /100 | #137 | Excellent 2.9% |