Malaysian vs Korean Disability Age Under 5
COMPARE
Malaysian
Korean
Disability Age Under 5
Disability Age Under 5 Comparison
Malaysians
Koreans
1.3%
DISABILITY AGE UNDER 5
13.2/ 100
METRIC RATING
218th/ 347
METRIC RANK
1.2%
DISABILITY AGE UNDER 5
87.7/ 100
METRIC RATING
130th/ 347
METRIC RANK
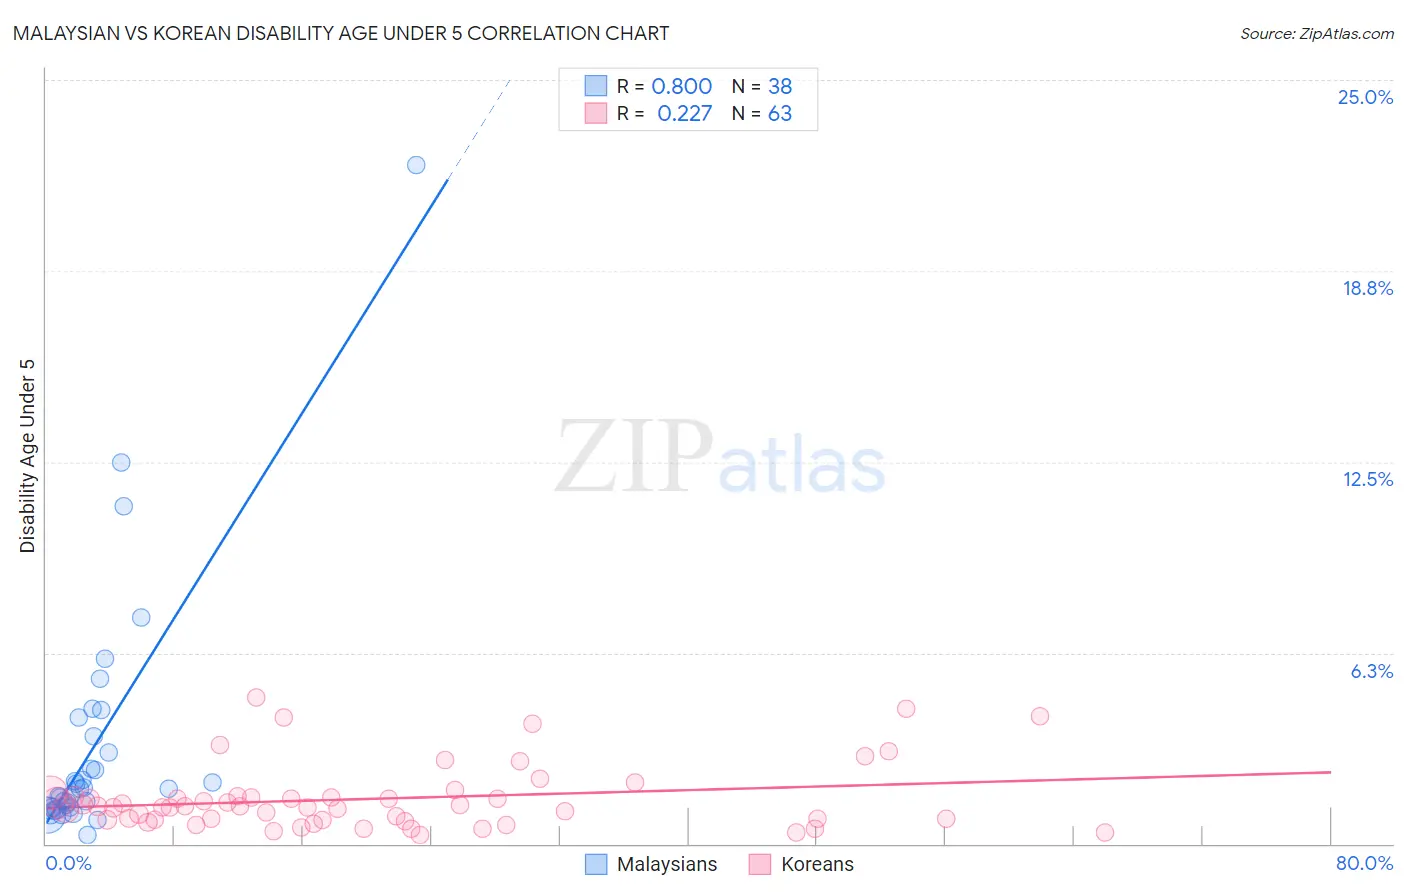
Malaysian vs Korean Disability Age Under 5 Correlation Chart
The statistical analysis conducted on geographies consisting of 149,792,432 people shows a strong positive correlation between the proportion of Malaysians and percentage of population with a disability under the age of 5 in the United States with a correlation coefficient (R) of 0.800 and weighted average of 1.3%. Similarly, the statistical analysis conducted on geographies consisting of 251,527,080 people shows a weak positive correlation between the proportion of Koreans and percentage of population with a disability under the age of 5 in the United States with a correlation coefficient (R) of 0.227 and weighted average of 1.2%, a difference of 9.1%.
Disability Age Under 5 Correlation Summary
| Measurement | Malaysian | Korean |
| Minimum | 0.28% | 0.27% |
| Maximum | 22.2% | 4.8% |
| Range | 21.9% | 4.5% |
| Mean | 3.2% | 1.5% |
| Median | 1.8% | 1.2% |
| Interquartile 25% (IQ1) | 1.2% | 0.79% |
| Interquartile 75% (IQ3) | 3.5% | 1.6% |
| Interquartile Range (IQR) | 2.3% | 0.77% |
| Standard Deviation (Sample) | 4.1% | 1.1% |
| Standard Deviation (Population) | 4.1% | 1.1% |
Similar Demographics by Disability Age Under 5
Demographics Similar to Malaysians by Disability Age Under 5
In terms of disability age under 5, the demographic groups most similar to Malaysians are Cypriot (1.3%, a difference of 0.31%), Immigrants from Croatia (1.3%, a difference of 0.40%), Bangladeshi (1.3%, a difference of 0.41%), Syrian (1.3%, a difference of 0.51%), and Immigrants from Chile (1.3%, a difference of 0.68%).
| Demographics | Rating | Rank | Disability Age Under 5 |
| Immigrants | Greece | 19.1 /100 | #211 | Poor 1.3% |
| Chileans | 18.8 /100 | #212 | Poor 1.3% |
| Immigrants | Sudan | 18.7 /100 | #213 | Poor 1.3% |
| Immigrants | Chile | 17.2 /100 | #214 | Poor 1.3% |
| Syrians | 16.1 /100 | #215 | Poor 1.3% |
| Bangladeshis | 15.5 /100 | #216 | Poor 1.3% |
| Cypriots | 14.9 /100 | #217 | Poor 1.3% |
| Malaysians | 13.2 /100 | #218 | Poor 1.3% |
| Immigrants | Croatia | 11.2 /100 | #219 | Poor 1.3% |
| Serbians | 9.6 /100 | #220 | Tragic 1.3% |
| Sub-Saharan Africans | 8.3 /100 | #221 | Tragic 1.3% |
| Ukrainians | 8.3 /100 | #222 | Tragic 1.3% |
| Hispanics or Latinos | 7.7 /100 | #223 | Tragic 1.3% |
| Latvians | 7.1 /100 | #224 | Tragic 1.3% |
| Panamanians | 7.1 /100 | #225 | Tragic 1.3% |
Demographics Similar to Koreans by Disability Age Under 5
In terms of disability age under 5, the demographic groups most similar to Koreans are Immigrants from Serbia (1.2%, a difference of 0.020%), Immigrants (1.2%, a difference of 0.080%), Immigrants from Eastern Europe (1.2%, a difference of 0.090%), Immigrants from Romania (1.2%, a difference of 0.17%), and Immigrants from France (1.2%, a difference of 0.17%).
| Demographics | Rating | Rank | Disability Age Under 5 |
| Zimbabweans | 90.6 /100 | #123 | Exceptional 1.2% |
| Immigrants | Cambodia | 90.5 /100 | #124 | Exceptional 1.2% |
| Japanese | 90.3 /100 | #125 | Exceptional 1.2% |
| Central Americans | 89.7 /100 | #126 | Excellent 1.2% |
| Immigrants | Romania | 88.4 /100 | #127 | Excellent 1.2% |
| Immigrants | France | 88.4 /100 | #128 | Excellent 1.2% |
| Immigrants | Immigrants | 88.0 /100 | #129 | Excellent 1.2% |
| Koreans | 87.7 /100 | #130 | Excellent 1.2% |
| Immigrants | Serbia | 87.6 /100 | #131 | Excellent 1.2% |
| Immigrants | Eastern Europe | 87.3 /100 | #132 | Excellent 1.2% |
| Immigrants | Spain | 86.5 /100 | #133 | Excellent 1.2% |
| Argentineans | 85.7 /100 | #134 | Excellent 1.2% |
| Fijians | 84.7 /100 | #135 | Excellent 1.2% |
| Moroccans | 83.6 /100 | #136 | Excellent 1.2% |
| Immigrants | Eastern Africa | 83.1 /100 | #137 | Excellent 1.2% |