Malaysian vs Ugandan Disability Age Under 5
COMPARE
Malaysian
Ugandan
Disability Age Under 5
Disability Age Under 5 Comparison
Malaysians
Ugandans
1.3%
DISABILITY AGE UNDER 5
13.2/ 100
METRIC RATING
218th/ 347
METRIC RANK
1.1%
DISABILITY AGE UNDER 5
97.5/ 100
METRIC RATING
87th/ 347
METRIC RANK
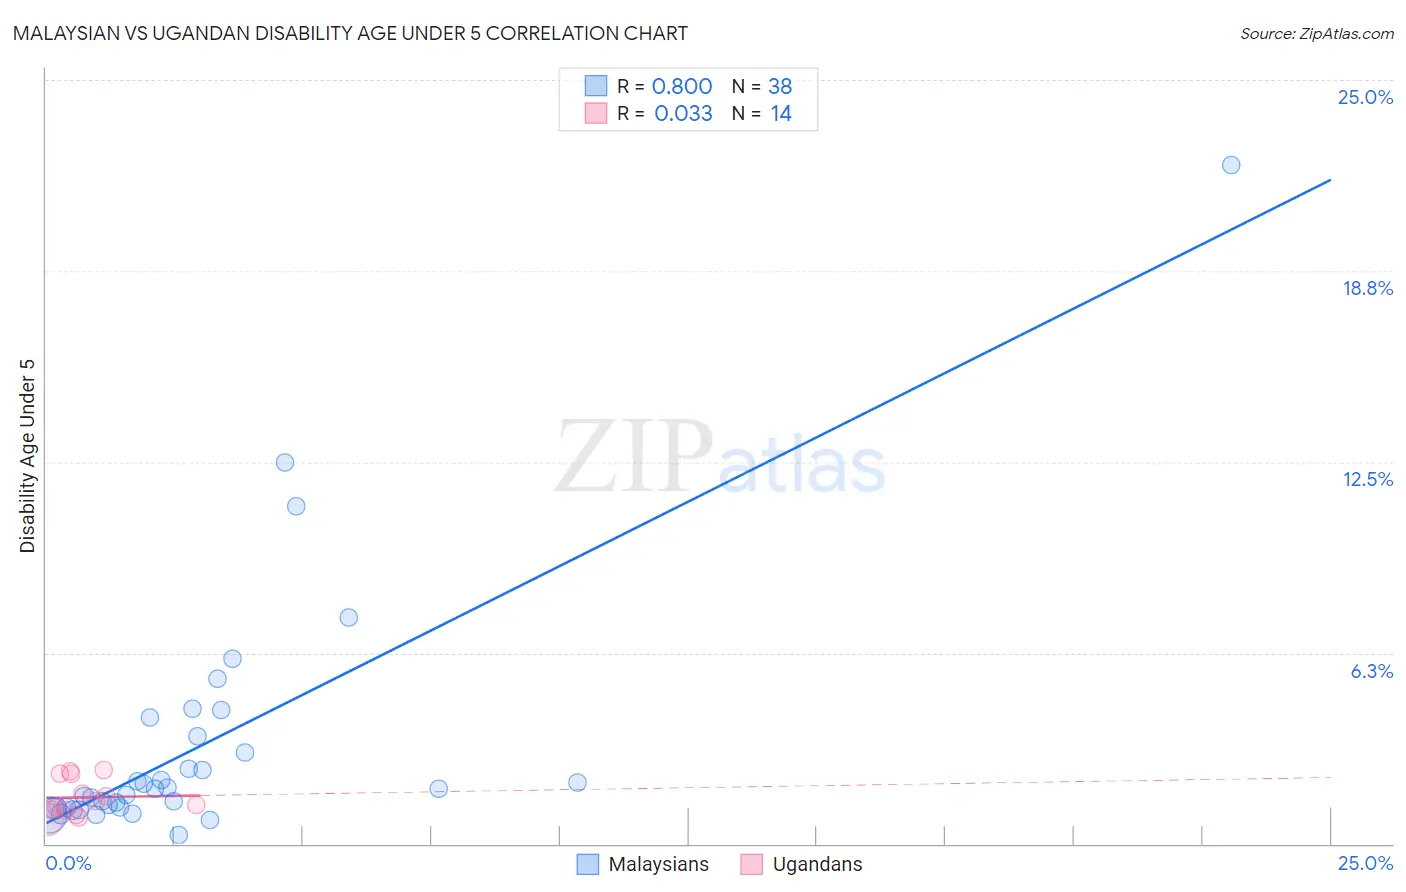
Malaysian vs Ugandan Disability Age Under 5 Correlation Chart
The statistical analysis conducted on geographies consisting of 149,792,432 people shows a strong positive correlation between the proportion of Malaysians and percentage of population with a disability under the age of 5 in the United States with a correlation coefficient (R) of 0.800 and weighted average of 1.3%. Similarly, the statistical analysis conducted on geographies consisting of 75,065,074 people shows no correlation between the proportion of Ugandans and percentage of population with a disability under the age of 5 in the United States with a correlation coefficient (R) of 0.033 and weighted average of 1.1%, a difference of 13.7%.
Disability Age Under 5 Correlation Summary
| Measurement | Malaysian | Ugandan |
| Minimum | 0.28% | 0.80% |
| Maximum | 22.2% | 2.4% |
| Range | 21.9% | 1.6% |
| Mean | 3.2% | 1.5% |
| Median | 1.8% | 1.3% |
| Interquartile 25% (IQ1) | 1.2% | 1.1% |
| Interquartile 75% (IQ3) | 3.5% | 2.3% |
| Interquartile Range (IQR) | 2.3% | 1.2% |
| Standard Deviation (Sample) | 4.1% | 0.59% |
| Standard Deviation (Population) | 4.1% | 0.57% |
Similar Demographics by Disability Age Under 5
Demographics Similar to Malaysians by Disability Age Under 5
In terms of disability age under 5, the demographic groups most similar to Malaysians are Cypriot (1.3%, a difference of 0.31%), Immigrants from Croatia (1.3%, a difference of 0.40%), Bangladeshi (1.3%, a difference of 0.41%), Syrian (1.3%, a difference of 0.51%), and Immigrants from Chile (1.3%, a difference of 0.68%).
| Demographics | Rating | Rank | Disability Age Under 5 |
| Immigrants | Greece | 19.1 /100 | #211 | Poor 1.3% |
| Chileans | 18.8 /100 | #212 | Poor 1.3% |
| Immigrants | Sudan | 18.7 /100 | #213 | Poor 1.3% |
| Immigrants | Chile | 17.2 /100 | #214 | Poor 1.3% |
| Syrians | 16.1 /100 | #215 | Poor 1.3% |
| Bangladeshis | 15.5 /100 | #216 | Poor 1.3% |
| Cypriots | 14.9 /100 | #217 | Poor 1.3% |
| Malaysians | 13.2 /100 | #218 | Poor 1.3% |
| Immigrants | Croatia | 11.2 /100 | #219 | Poor 1.3% |
| Serbians | 9.6 /100 | #220 | Tragic 1.3% |
| Sub-Saharan Africans | 8.3 /100 | #221 | Tragic 1.3% |
| Ukrainians | 8.3 /100 | #222 | Tragic 1.3% |
| Hispanics or Latinos | 7.7 /100 | #223 | Tragic 1.3% |
| Latvians | 7.1 /100 | #224 | Tragic 1.3% |
| Panamanians | 7.1 /100 | #225 | Tragic 1.3% |
Demographics Similar to Ugandans by Disability Age Under 5
In terms of disability age under 5, the demographic groups most similar to Ugandans are Okinawan (1.1%, a difference of 0.020%), Immigrants from Dominican Republic (1.1%, a difference of 0.020%), Sudanese (1.1%, a difference of 0.14%), Immigrants from Zaire (1.1%, a difference of 0.22%), and Ethiopian (1.1%, a difference of 0.31%).
| Demographics | Rating | Rank | Disability Age Under 5 |
| Immigrants | Trinidad and Tobago | 98.0 /100 | #80 | Exceptional 1.1% |
| Turks | 98.0 /100 | #81 | Exceptional 1.1% |
| Immigrants | Jordan | 97.9 /100 | #82 | Exceptional 1.1% |
| Immigrants | Syria | 97.9 /100 | #83 | Exceptional 1.1% |
| Immigrants | Zaire | 97.8 /100 | #84 | Exceptional 1.1% |
| Sudanese | 97.7 /100 | #85 | Exceptional 1.1% |
| Okinawans | 97.6 /100 | #86 | Exceptional 1.1% |
| Ugandans | 97.5 /100 | #87 | Exceptional 1.1% |
| Immigrants | Dominican Republic | 97.5 /100 | #88 | Exceptional 1.1% |
| Ethiopians | 97.2 /100 | #89 | Exceptional 1.1% |
| Chinese | 97.2 /100 | #90 | Exceptional 1.1% |
| Albanians | 97.2 /100 | #91 | Exceptional 1.1% |
| Immigrants | Cuba | 97.0 /100 | #92 | Exceptional 1.1% |
| Spanish Americans | 96.9 /100 | #93 | Exceptional 1.1% |
| Sri Lankans | 96.8 /100 | #94 | Exceptional 1.1% |